
September 2026 Phoenix Housing Market Update
Sellers came back for fall. Then mortgage rates crossed 7% — and buyers stepped back.
The September 2026 Phoenix market in 30 seconds
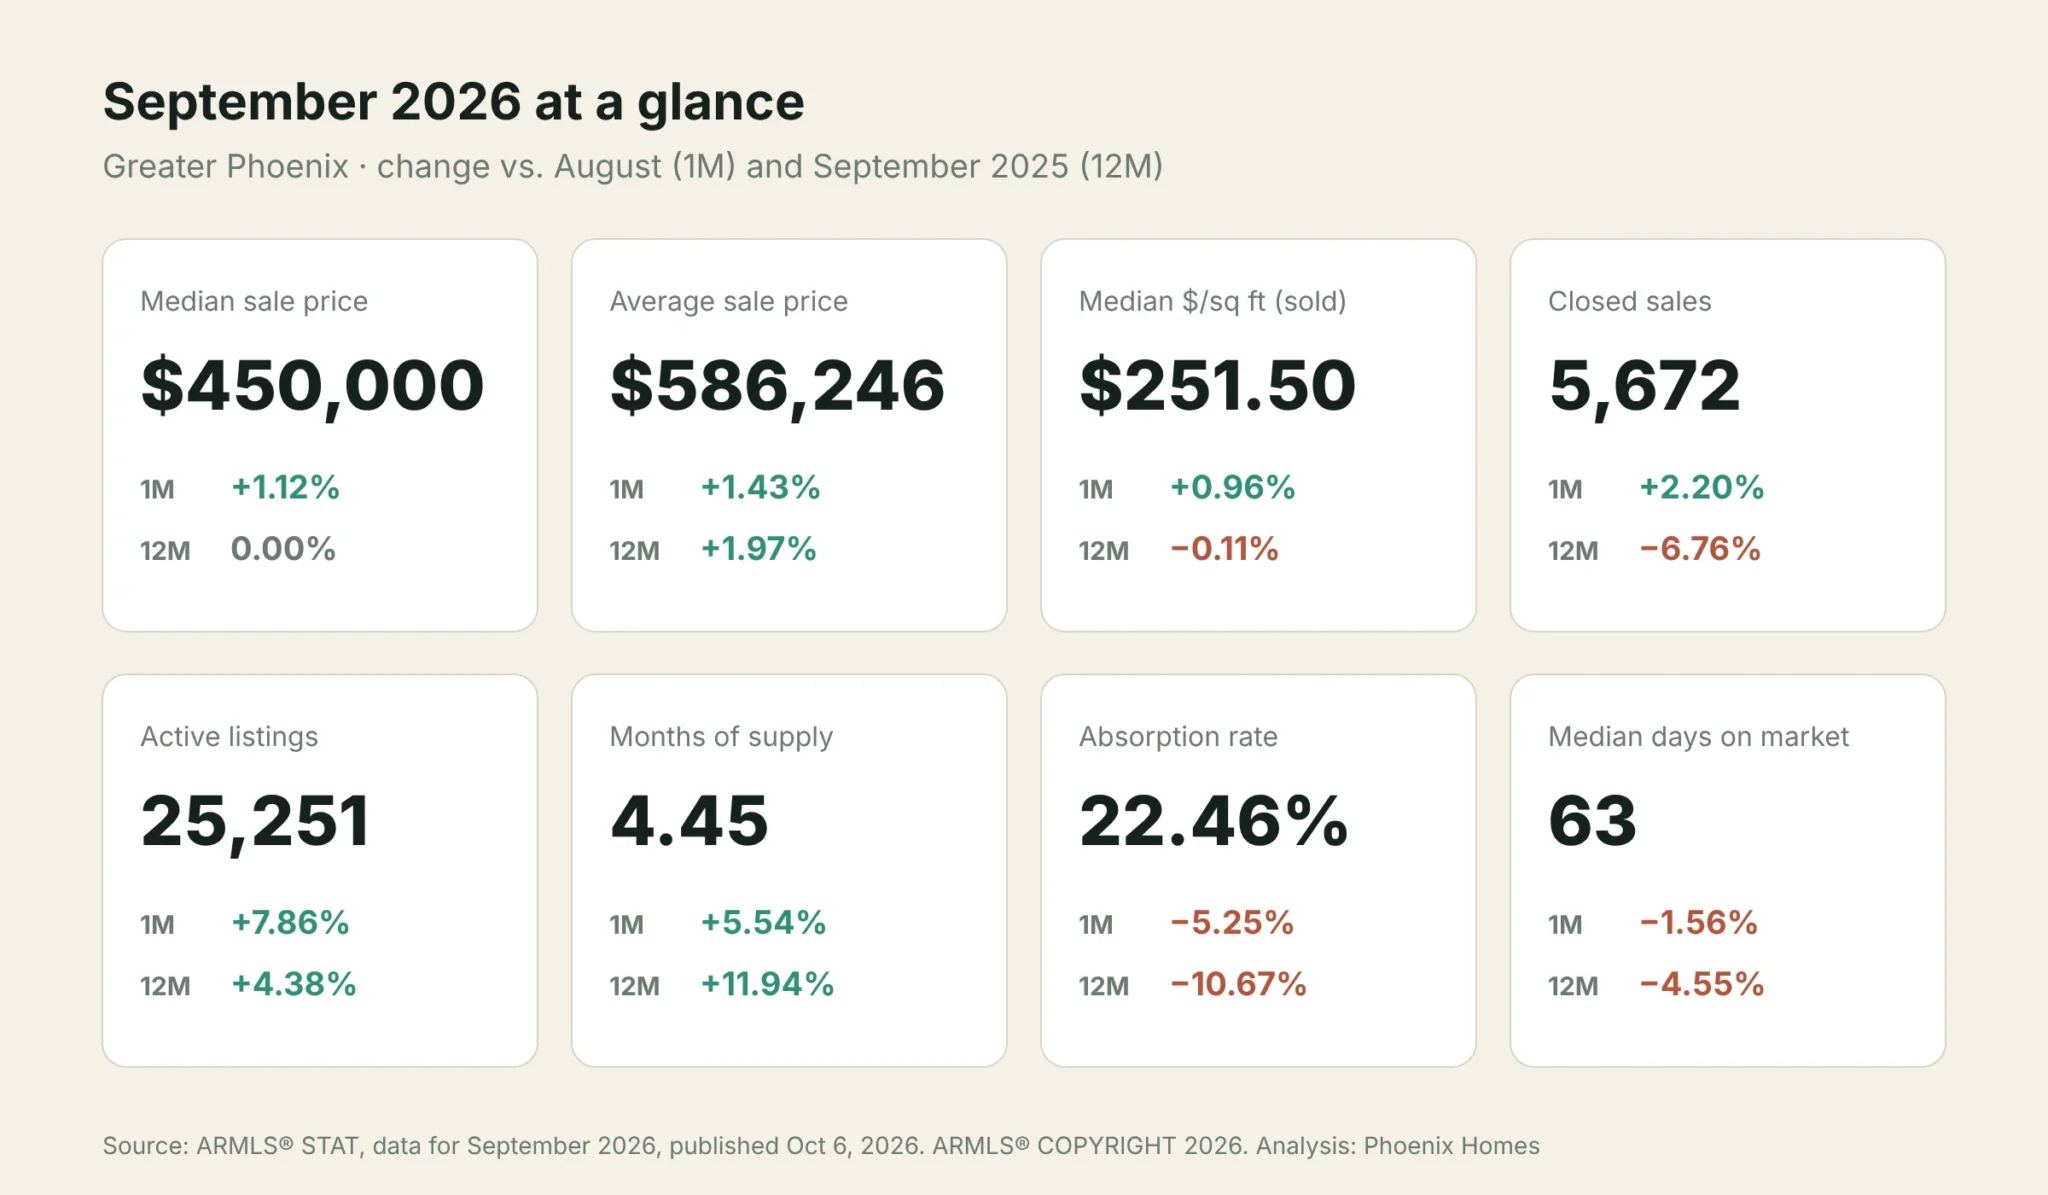
- Prices held: median sale price $450,000 — up 1.12% from August, flat year over year.
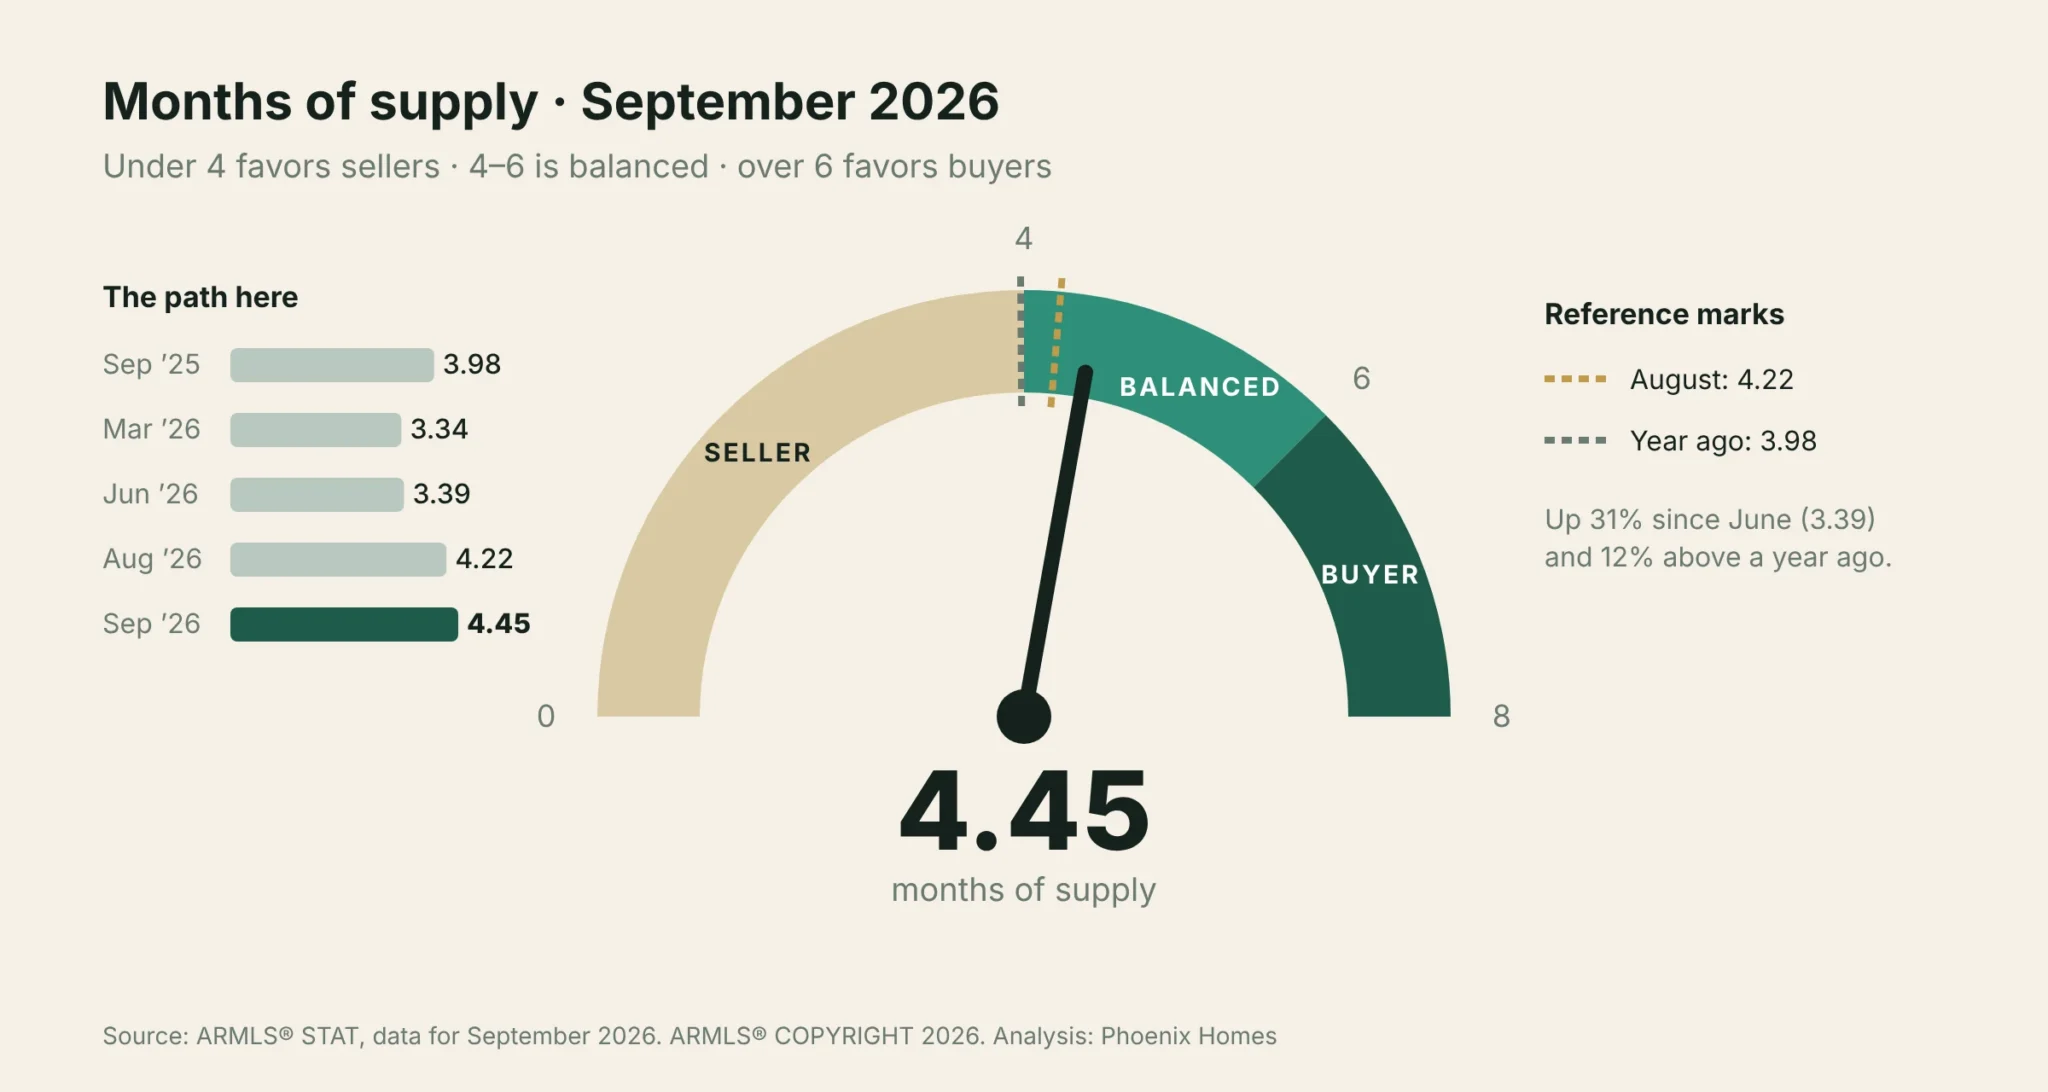
- Supply grew: 25,251 active listings and 4.45 months of supply, firmly in balanced territory.
- Demand slipped: homes under contract fell 10.39% to 6,057 as the 30-year rate climbed to 7.28%.
- Negotiation room widened: the median new list price now sits $25,000 above the median sale price.
September is when the Greater Phoenix market wakes up from summer, and this year the sellers clearly got the memo. New listings jumped 15.03% from August to 9,350, pushing active inventory to 25,251 homes — 4.38% more than a year ago. Months of supply rose to 4.45, the second straight month above the four-month line that separates a seller-leaning market from a balanced one.
The buyers, however, ran into a headwind. Mortgage rates rose every week of September, crossed 7% for the first time since early 2025, and the Federal Reserve raised its benchmark rate for the first time since 2023. The result is a market where prices are steady, choice is abundant, and the monthly payment — not the sticker price — is what is deciding deals.
Prices are steady — the story is leverage, not value
If you only read one number, read this one: the Greater Phoenix median sale price was $450,000 in September, exactly where it was in September 2025. The average sale price rose 1.97% year over year to $586,246, and the median price per square foot ($251.50) is essentially unchanged from a year ago (−0.11%). Values are not falling; they are holding.
What is moving is the balance of power. Months of supply is up 11.94% year over year, and the absorption rate — the share of active inventory that sells each month — slipped to 22.46% from 25.14% a year ago. More homes are competing for each buyer, and that shows up in the gap between asking and getting.
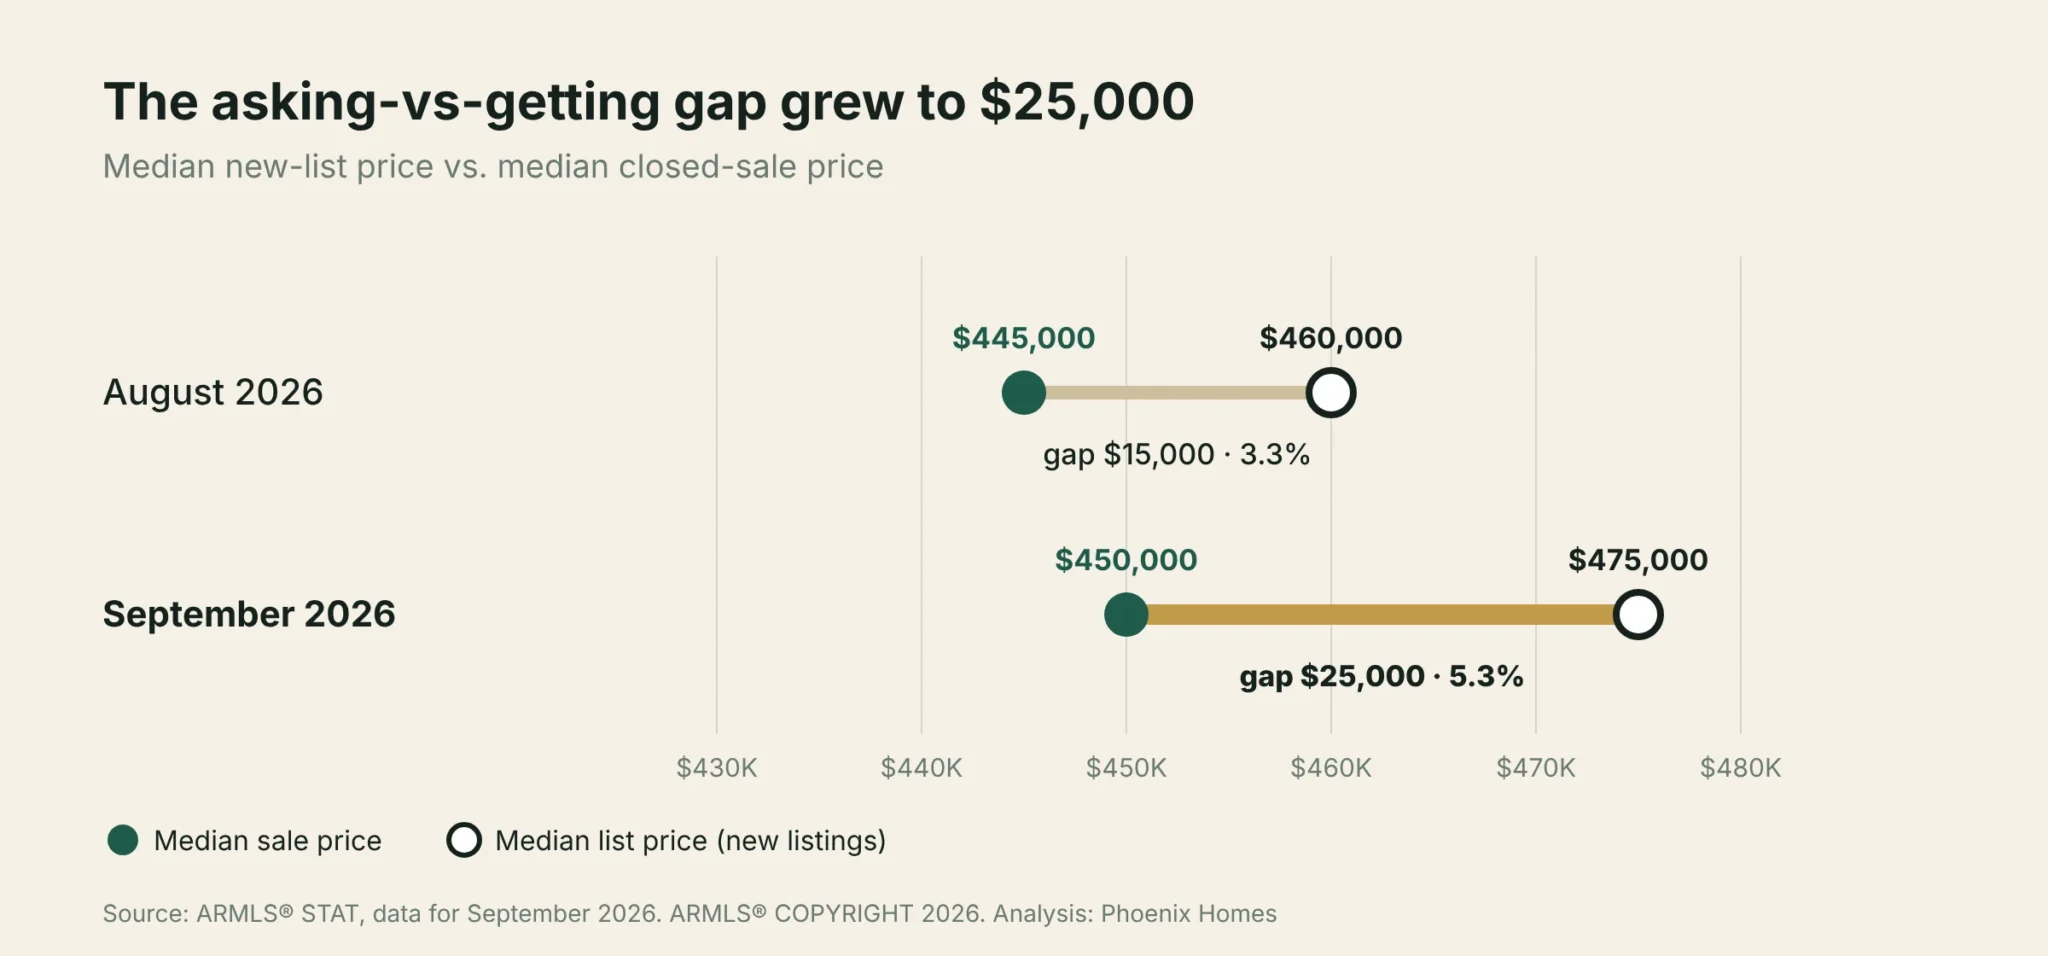
Median list price of new listings vs. median closed-sale price, August and September 2026.
The median price on new listings rose to $475,000 in September while the median sale price reached $450,000 — a $25,000 (5.3%) gap, up from $15,000 in August. The average list price of new listings jumped 10.58% to $720,666, a sign that more higher-priced and luxury homes came to market for the fall and winter season. Sellers are listing with optimism; buyers are closing at the comps.
Sellers showed up. Buyers hesitated.
The clearest signal in this month’s ARMLS report is the split between supply and demand. Listings poured in while contracts dried up:
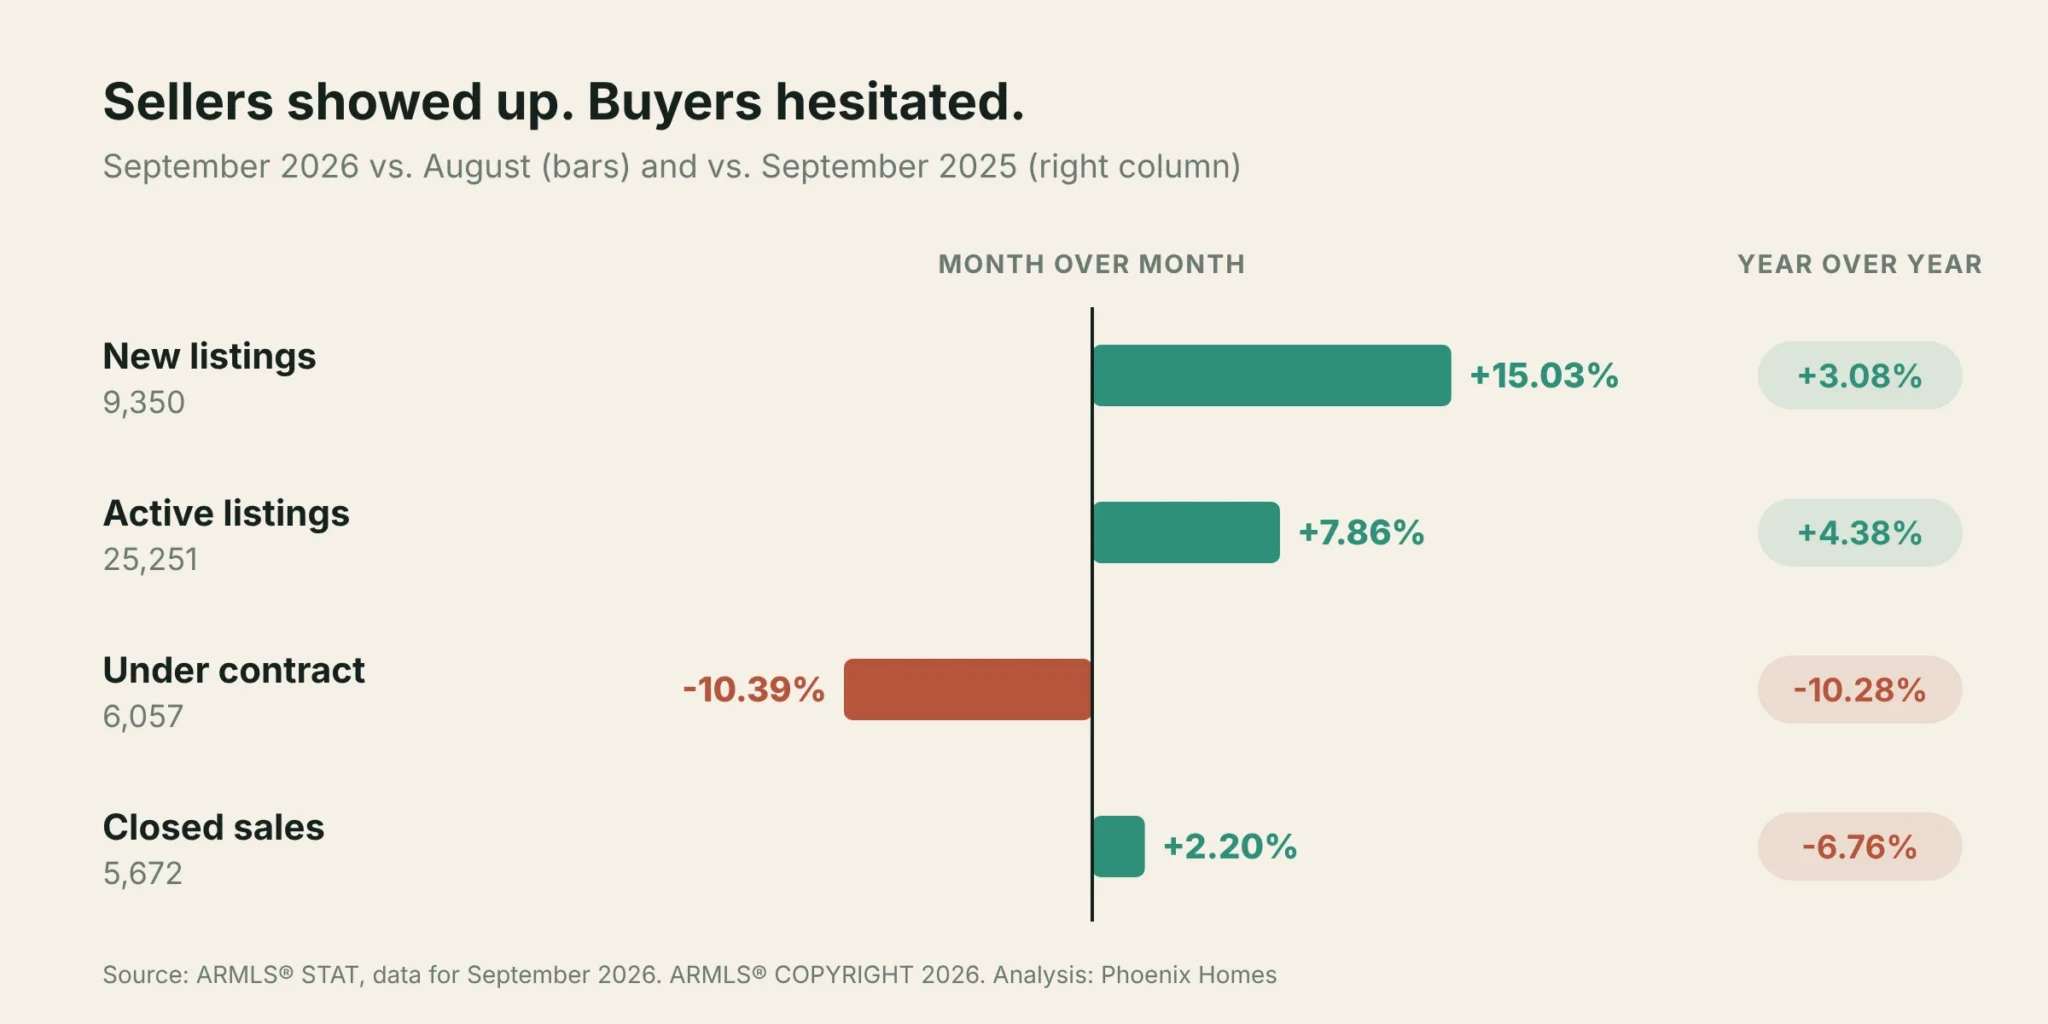
Change in new listings, active listings, under-contract listings and closed sales, September 2026.
Homes under contract — the best leading indicator for October and November closings — fell to 6,057, down 10.39% from August and 10.28% from September 2025. Put another way, Greater Phoenix added about 1.54 new listings for every home that went under contract in September, compared with about 1.34 a year ago. That is how inventory builds.
Closed sales rose a modest 2.20% from August to 5,672, but they remain 6.76% below last year, and those closings mostly reflect contracts written in July and August, before the latest rate spike. Expect the September pullback in contracts to show up in October’s closed-sale numbers.
One bright spot for sellers: homes that are priced right are not sitting longer. The median home went under contract in 63 days, slightly faster than August (64) and a year ago (66). Average days on market eased to 86. The market is rewarding accurate pricing, not punishing every listing.
Rates crossed 7% — and that changed the math
Higher borrowing costs explain most of September’s demand slowdown. Freddie Mac’s weekly 30-year fixed average went from 6.76% on September 10 to 6.95% on September 17, 7.03% on September 24 and 7.28% on October 1, compared with 6.34% a year earlier. On September 16 the Federal Reserve raised the federal funds target range a quarter point to 3.75%–4.00%, its first increase since July 2023, and its projections point to one more hike before year-end.
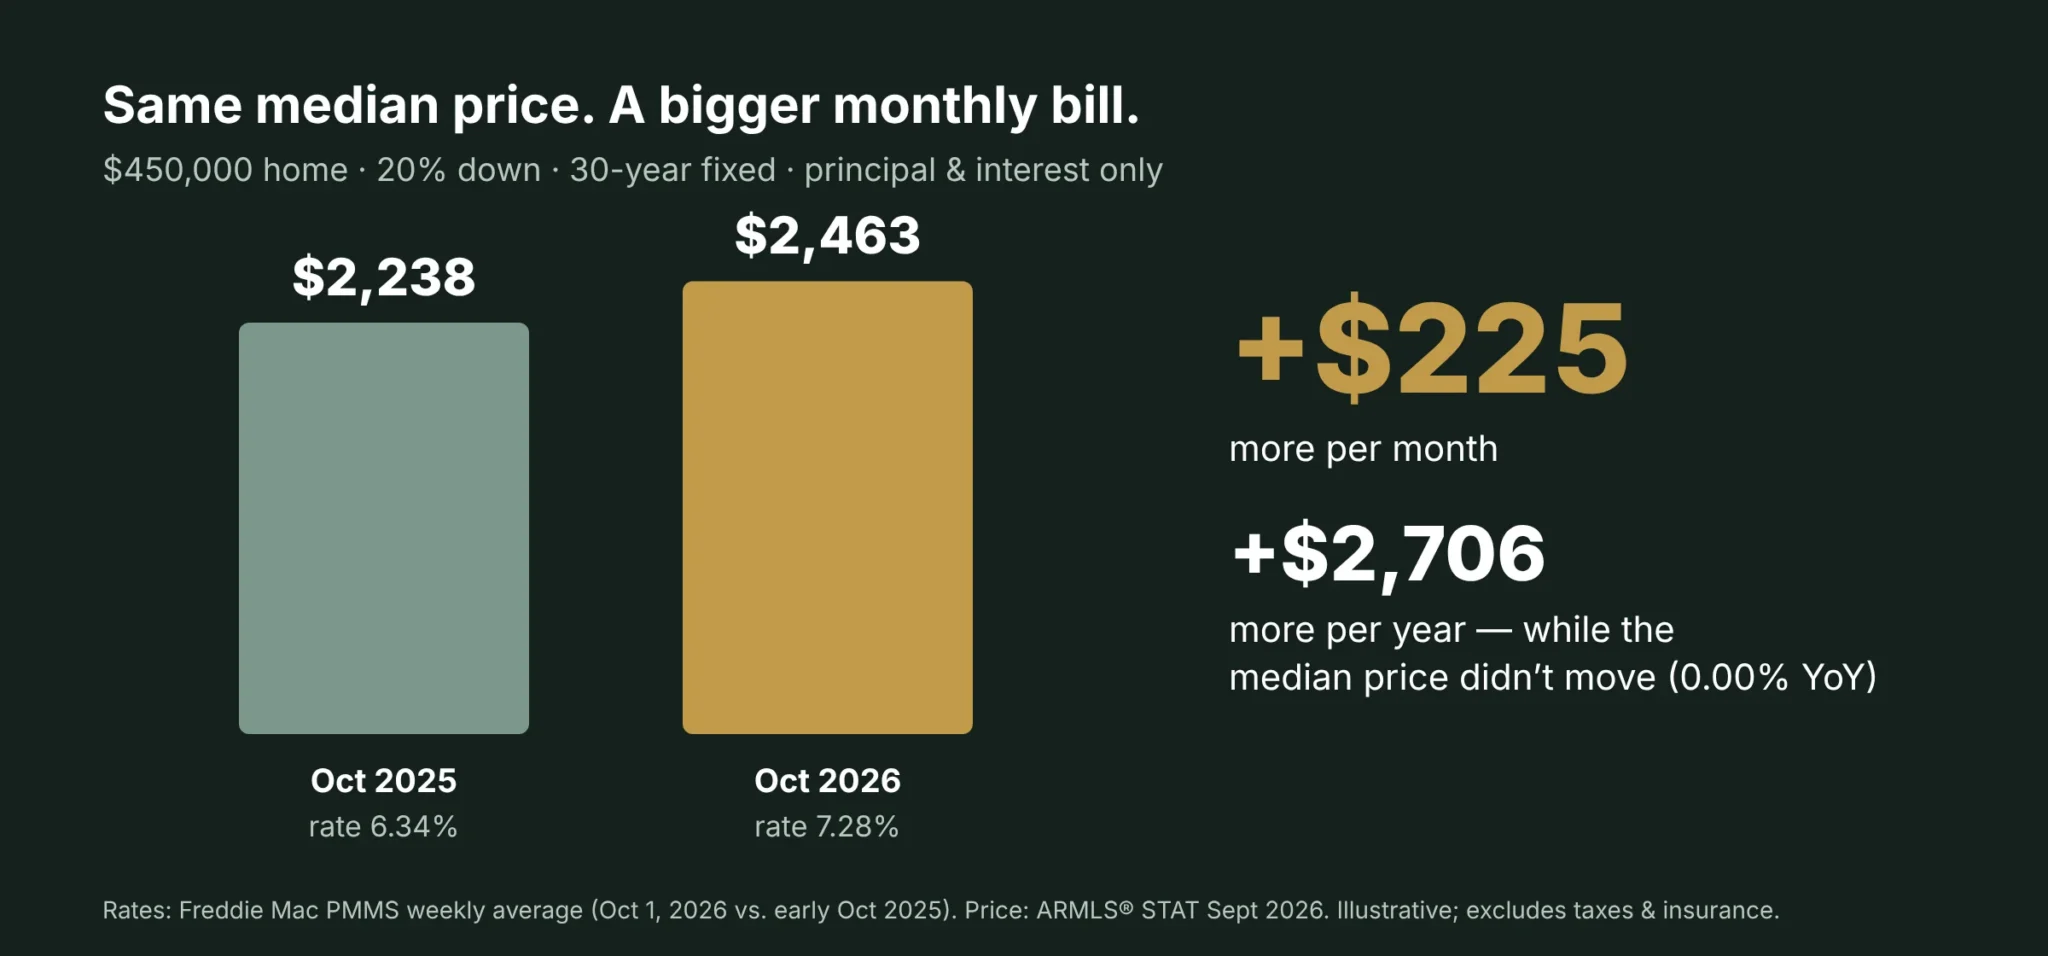
Here is why that matters even though prices haven’t moved: the same $450,000 median home now costs roughly $225 more per month in principal and interest than it did a year ago — about $2,700 a year — purely because of the rate. For many households that is the difference between qualifying and not, which is exactly what the drop in contracts reflects.
What to watch next: the Fed meets again October 27–28, and weekly rate readings will tell us whether 7% is a ceiling or a new floor. Waiting for a big rate drop is a bet against the Fed’s own projections, and it means giving up today’s inventory and negotiating room in the meantime.
The playbook for fall 2026
If you’re buying
- Shop the payment, not the price. Get pre-approved at today’s rate and know your monthly ceiling.
- Ask for a rate buydown. With a $25,000 list-to-sale gap, seller credits toward a 2-1 or permanent buydown often beat a price cut.
- Use the inventory. 25,000+ active listings means you can compare, inspect thoroughly and negotiate repairs.
- Look at homes past 60 days. Sellers on the market longer than the median are usually the most flexible.
If you’re selling
- Price to closed comps, not new listings. Buyers are paying around $450,000 at the median, not $475,000.
- Win the first two weeks. With 9,350 new listings in a month, presentation and pricing at launch decide your outcome.
- Offer the right concession. A buydown credit can widen your buyer pool more than the same dollars off the price.
- Plan for about two months. Median days on market is 63 — build that into your moving timeline.
Curious what this means for your specific home or neighborhood? Get a free home valuation, run your numbers with our mortgage calculator, or explore homes for sale across Greater Phoenix.
Full September 2026 ARMLS data
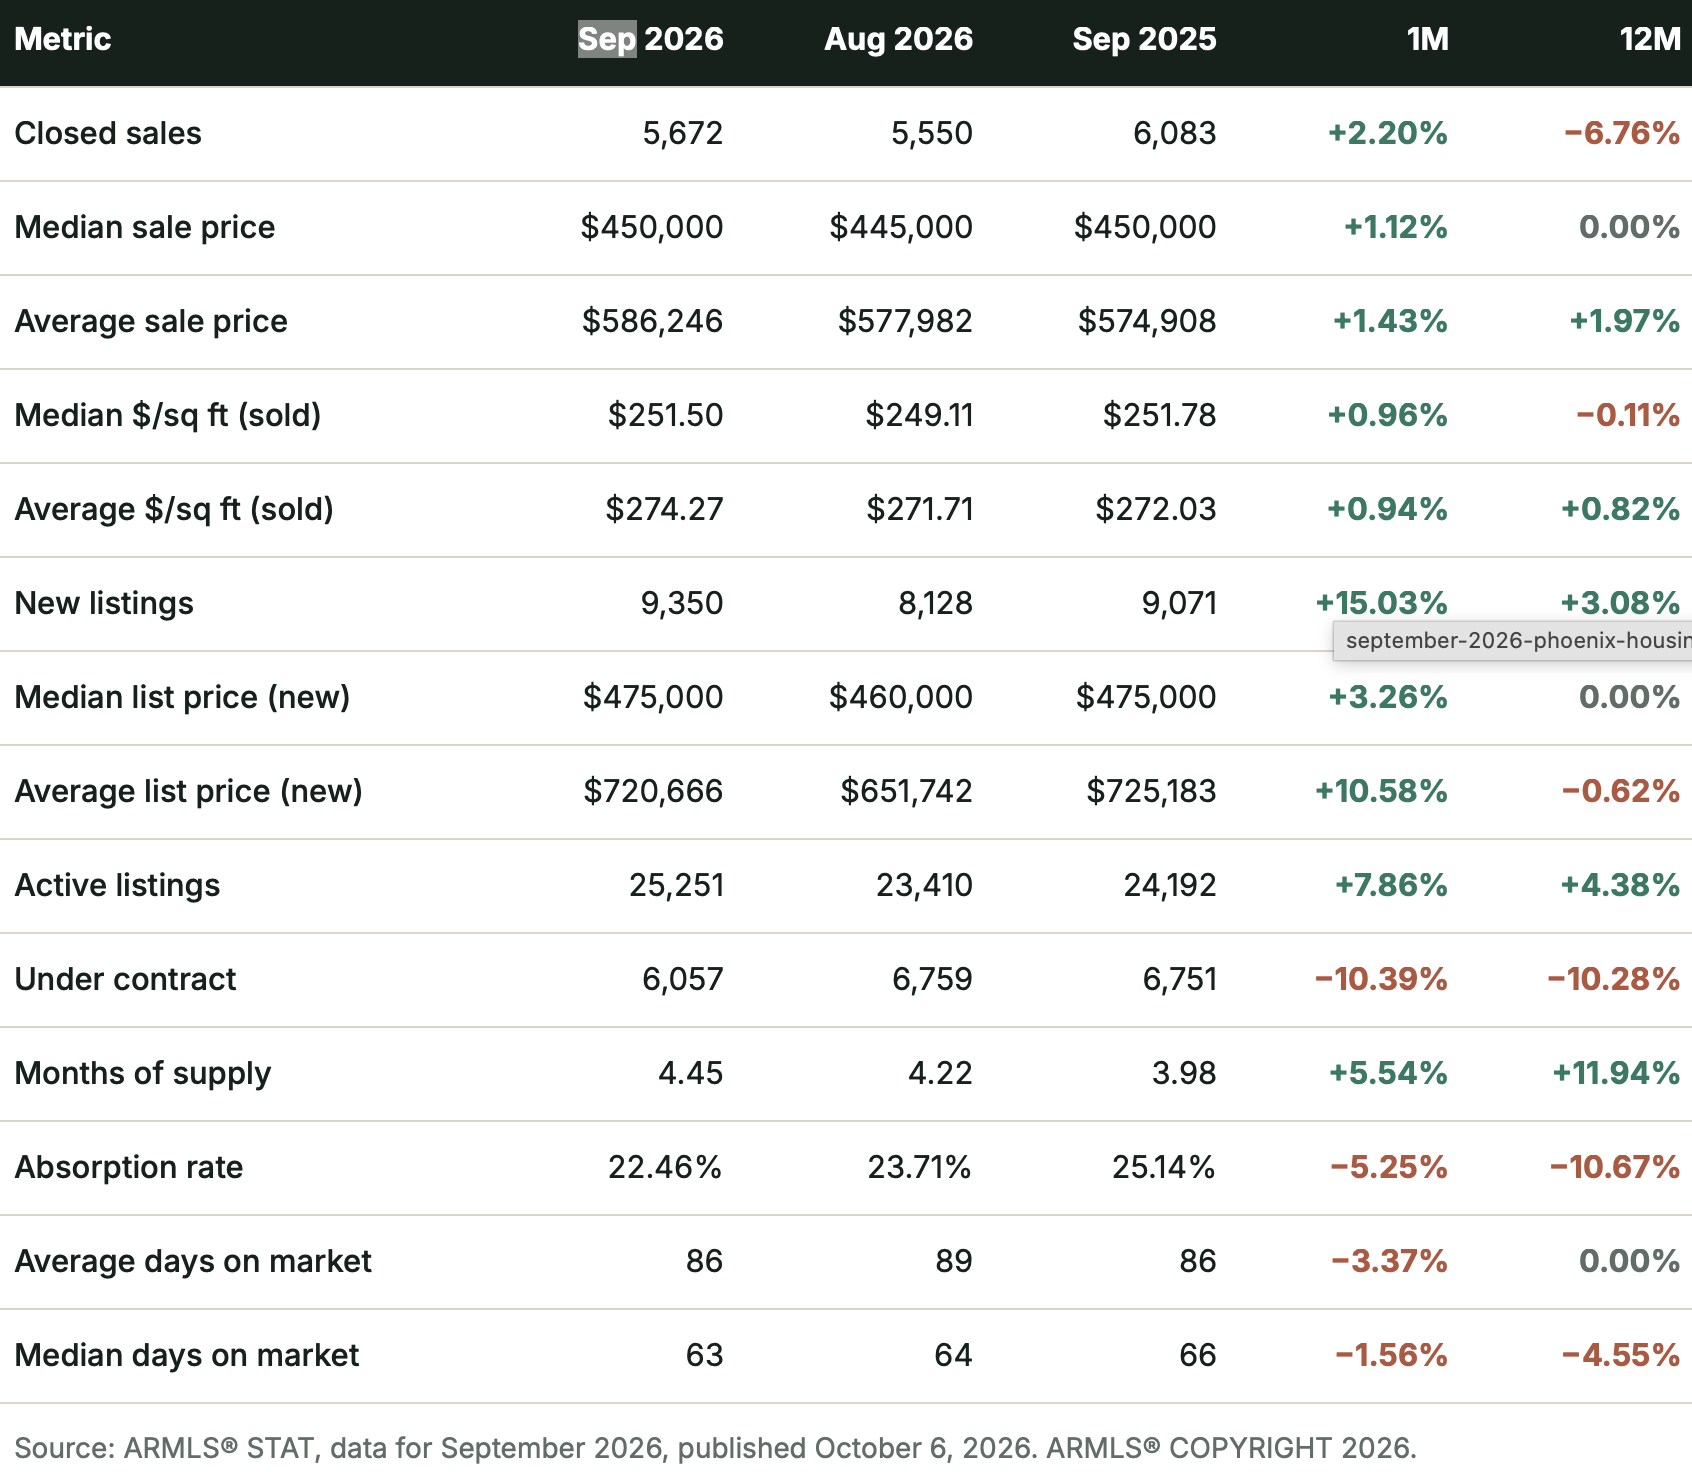
Greater Phoenix, all property types. Percent changes compare September 2026 with August 2026 (1M) and September 2025 (12M).
Phoenix housing market FAQ
Balanced, with negotiating leverage tilting toward buyers. Months of supply reached 4.45 in September, the second straight month inside the 4–6 month balanced range and up from 3.39 in June. The median list price of new listings ($475,000) now sits $25,000 above the median sale price ($450,000), so most homes are not selling at full ask.
Financing costs. The 30-year fixed rate climbed from 6.76% on September 10 to 7.03% on September 24 and 7.28% on October 1 (Freddie Mac), and the Federal Reserve raised its policy rate a quarter point on September 16. Homes under contract fell to 6,057, down 10.39% from August and 10.28% from a year earlier, even as new listings jumped 15.03%.
The national 30-year fixed average was 7.28% for the week of October 1, 2026 (Freddie Mac), a level not seen since early 2025, versus 6.34% a year earlier. On a $450,000 home with 20% down, that difference adds roughly $225 a month in principal and interest. Individual quotes vary by credit, loan type and points.
Buyers who can handle today's payment have the most choice and negotiating room in over a year: ask for seller-paid rate buydowns and closing credits rather than only a lower price. Sellers should price to recent closed comps, not to new list prices, and plan for roughly two months on market. The right move depends on your finances, so talk it through with an agent and a lender.