Phoenix Inventory Tightens for Summer, Even as Monthly Sales Volume Cools
ARMLS data shows the Valley’s absorption rate climbing and active supply shrinking year-over-year — a sign the market is quietly regaining balance despite the seasonal summer slowdown.
Published July 16, 2026 · Data through June 2026 · Source: ARMLS STAT
June is typically when the Phoenix housing market shifts gears for summer, and 2026 followed the pattern: new listings and pending contracts both pulled back sharply from May as triple-digit heat set in. But look past the month-over-month dip and the year-over-year story is the more important one — active inventory is down 5.3% from last June, and homes are absorbing 14% faster. That combination is usually the first sign a market is tilting back toward sellers after a longer stretch of buyer-friendly conditions.
The Big Picture
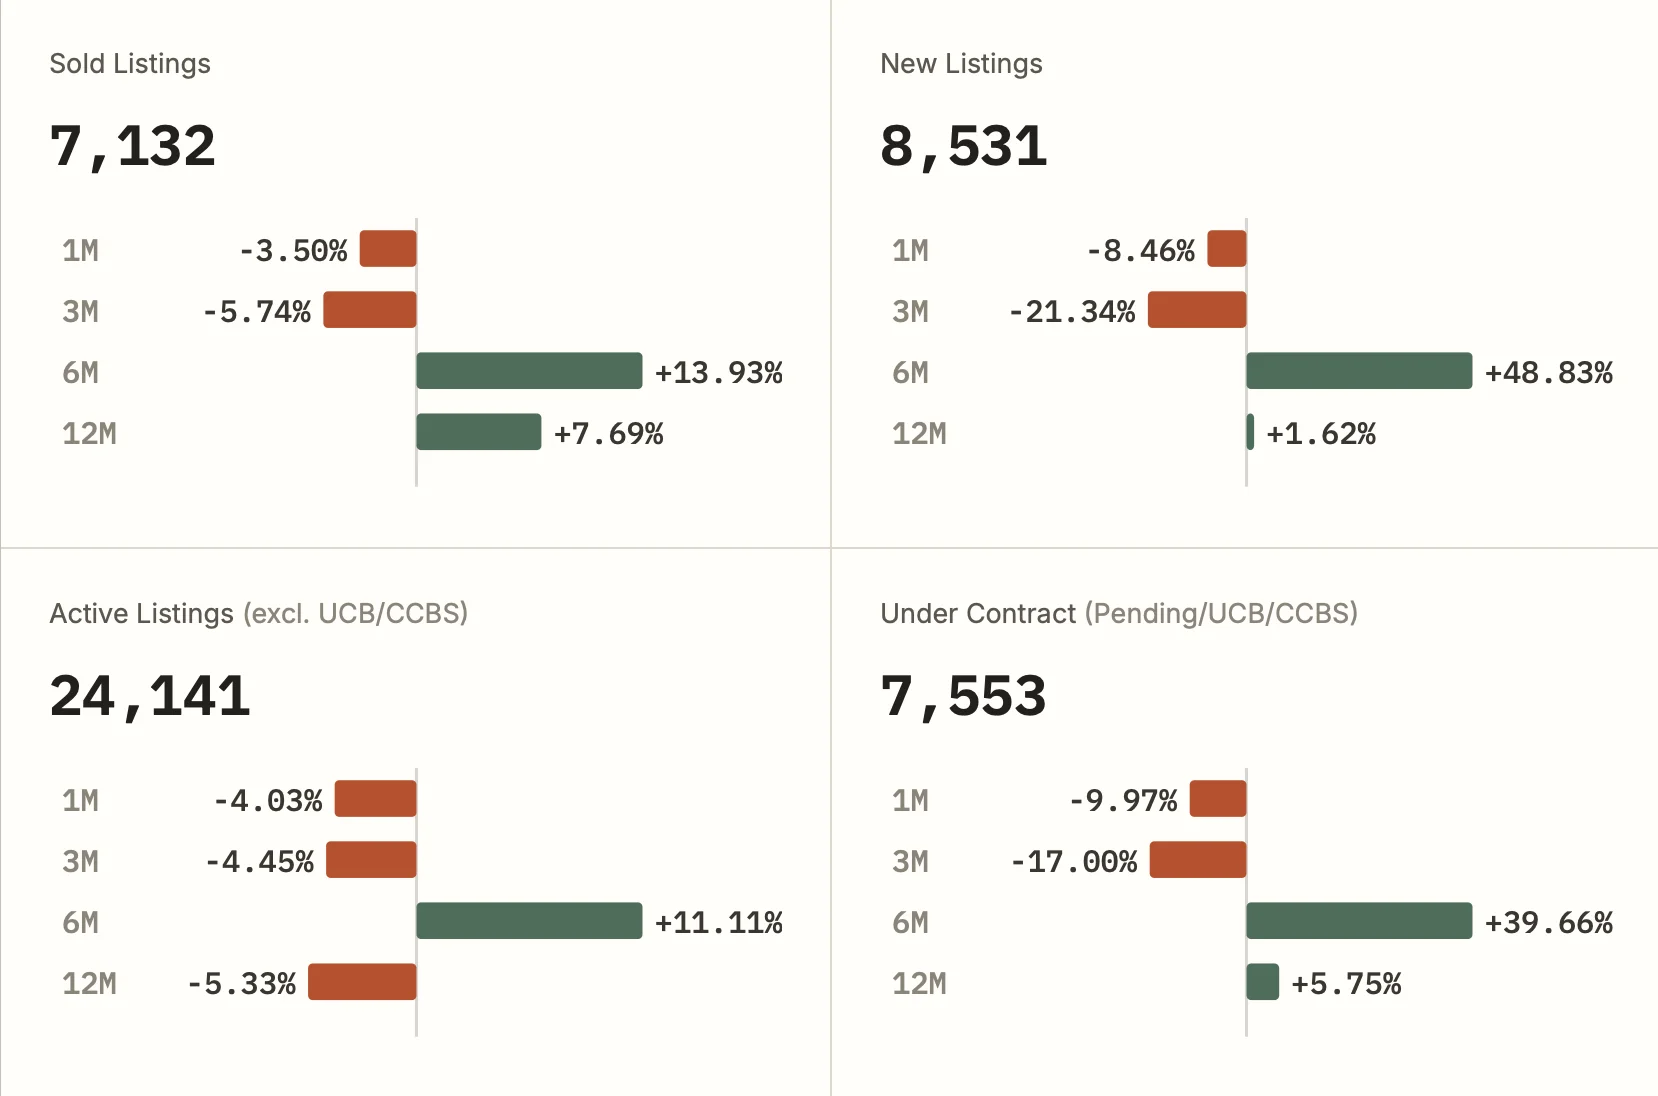
Sold, new, active, and under-contract listings across the Greater Phoenix metro, with each metric’s trend across the last 1, 3, 6, and 12 months.
The month-over-month pullback across every category tracks with the normal summer rhythm — sellers hold off listing during peak heat, and buyer activity slows with school schedules and 100°F+ days. What stands out is that sales and pending contracts are still running ahead of last June, while active inventory keeps shrinking. Fewer homes on the market, moving a little faster than a year ago, is the throughline for June.
Inventory & Pace: Supply and Absorption
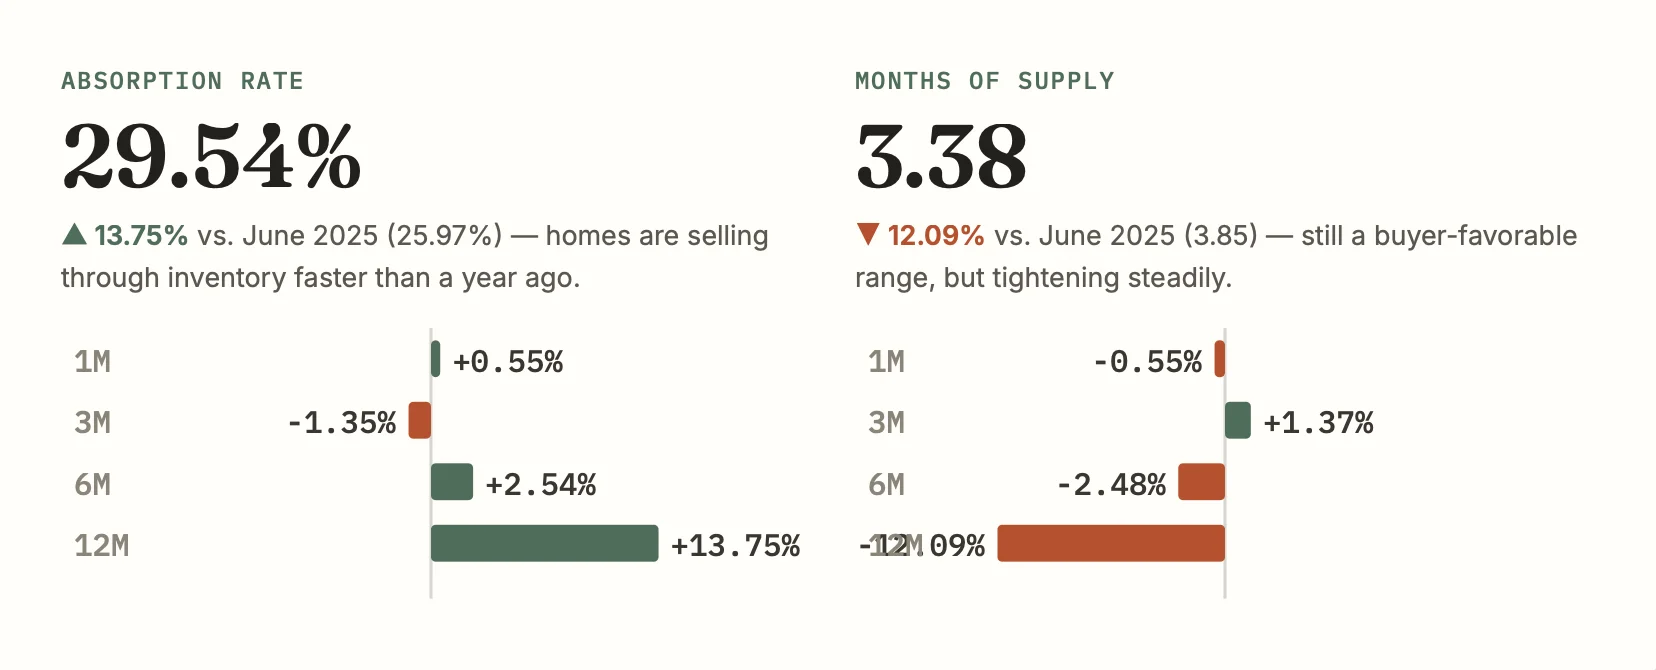
Months of supply measures how long it would take to sell current inventory at the current sales pace; absorption rate is the inverse view — the share of active inventory being sold each month.

Both metrics are telling the same story from opposite directions: supply is shrinking (3.38 months, down 12% YoY) and absorption is climbing (29.54%, up nearly 14% YoY). Anything under roughly 4-5 months of supply is generally considered favorable to sellers in most markets, and the Valley has now spent the better part of a year drifting toward that threshold rather than away from it.
Prices: Steady, Modest Appreciation
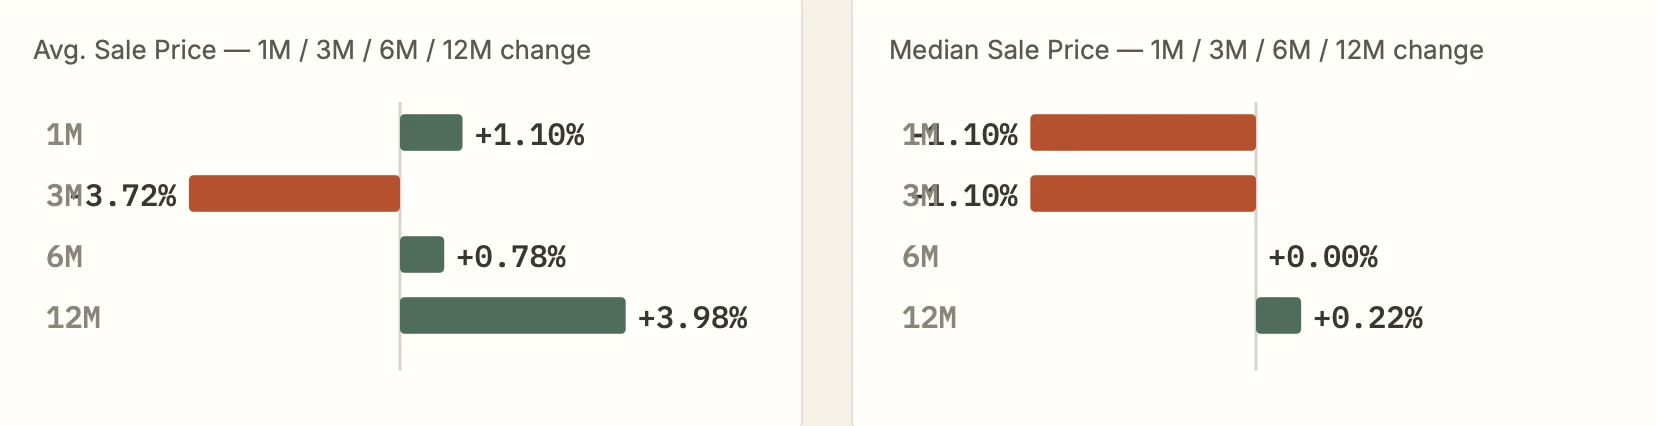
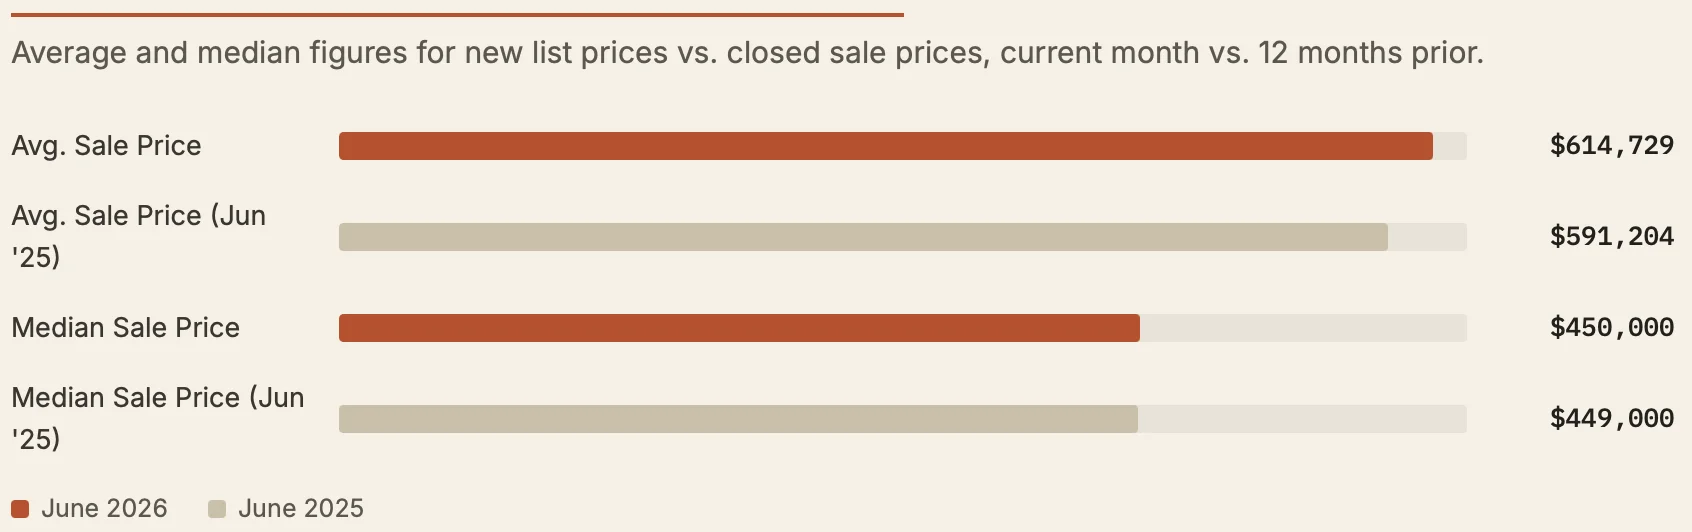
The average sale price climbed to $614,729, up nearly 4% from a year ago, while the median held almost flat at $450,000. That gap between average and median growth points to continued strength at the upper end of the market — luxury and view-lot sales are pulling the average up faster than the typical home is appreciating. New list prices tell a similar story: the median new listing is priced at $469,000, essentially unchanged year-over-year, which suggests sellers are pricing realistically rather than chasing the market.
Pace of the Market: Days on Market
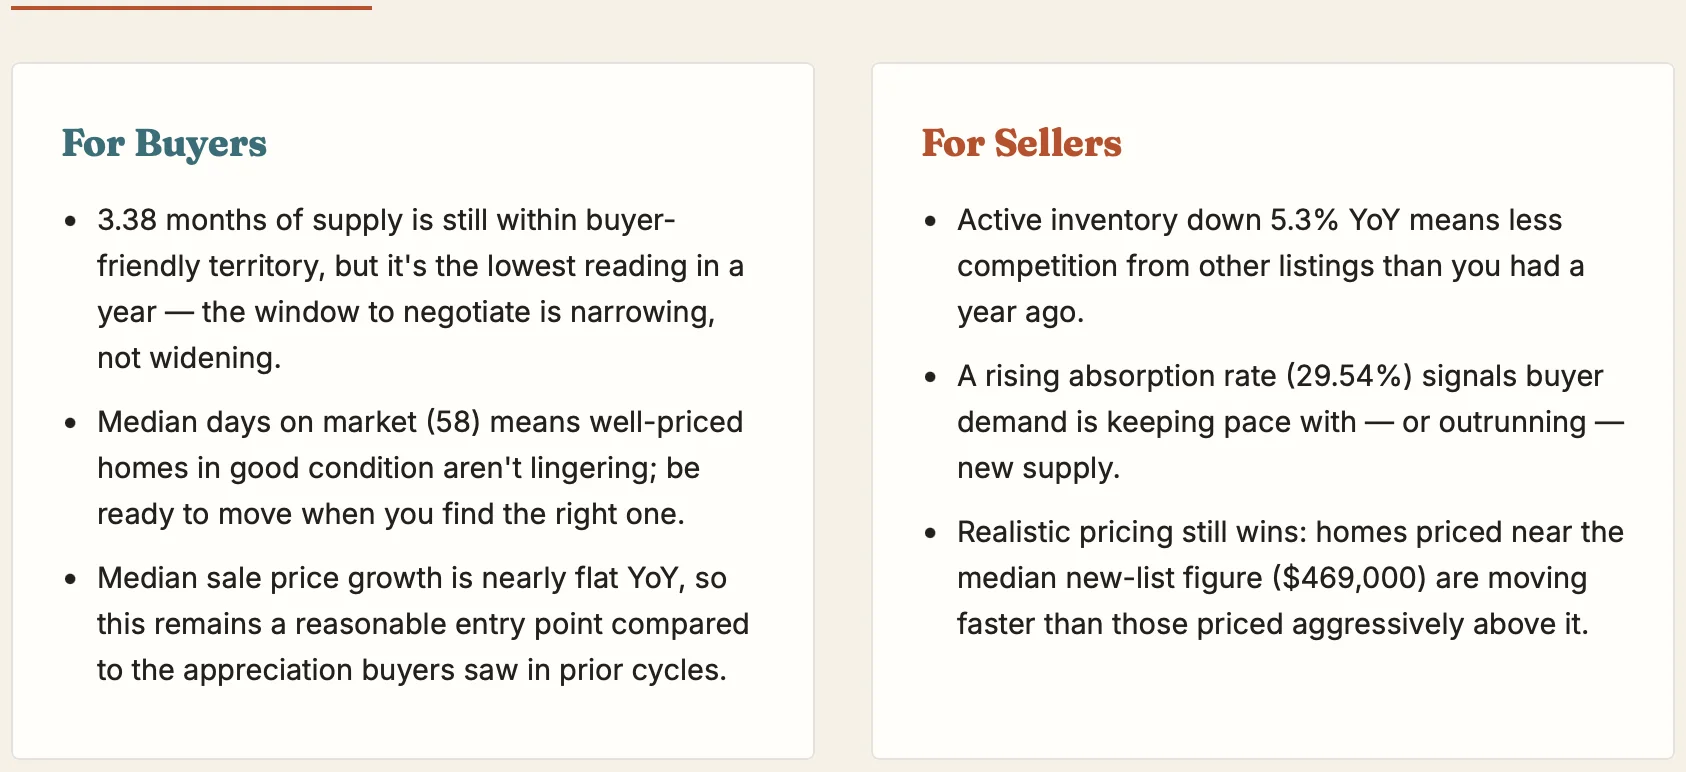
Homes are taking slightly longer to sell than they did a year ago — the average listing spent 85 days on market, up from 79 in June 2025. The median (58 days) barely moved, which matters more for most sellers: it means a typical, well-priced home is still moving at close to the same pace as last year. The gap between average and median DOM again reflects a stretched-out tail of overpriced or niche listings sitting longer, rather than a broad-based slowdown.
What It Means