
The Phoenix‑metro housing market has entered a new phase. After two years of frothy appreciation and bidding wars, May 2025 data from the Arizona Regional Multiple Listing Service (ARMLS) shows that supply has climbed and pricing has flattened. By early July, we’re seeing buyer leverage grow, an uptick in closed transactions and signs that the market correction is gentle rather than catastrophic. This report breaks down the numbers, explains what they mean and offers practical guidance for buyers and sellers.
May 2025 ARMLS statistics
Sold and new listings
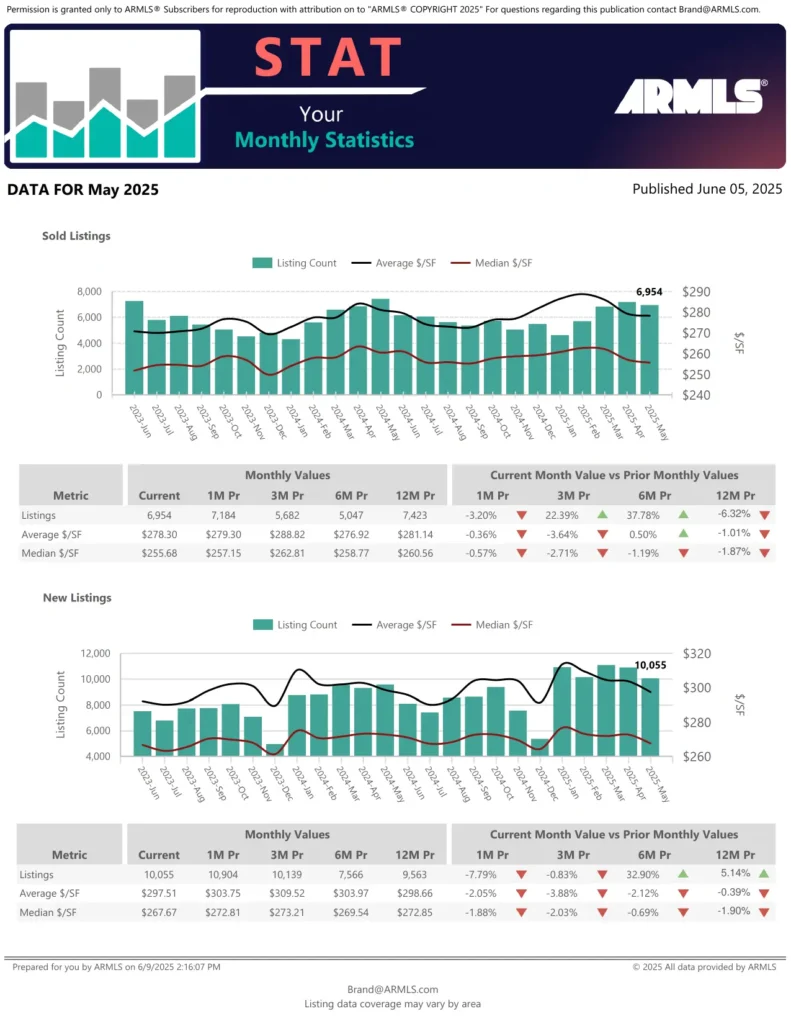
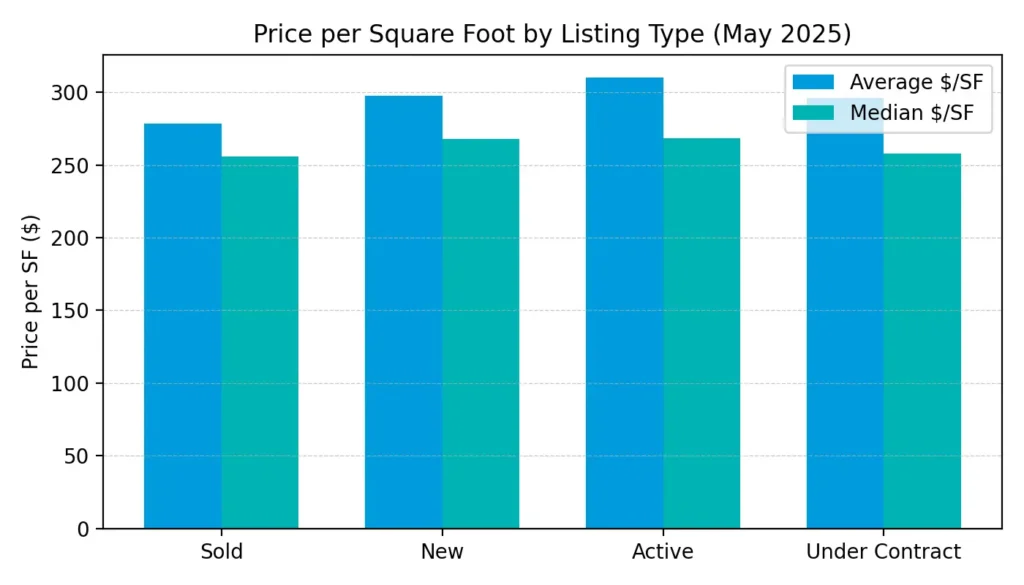
ARMLS tracks closed transactions (“sold listings”) separately from new listings coming to market. In May 2025 there were 6,954 sold listings, down 3.20 % from April yet up more than 37 % compared with six months earlier. The average sold price per square foot was $278.30, slightly below April and 3.64 % lower than the February high. Median pricing held better at $255.68 per sf, declining just 0.57 % month‑to‑month.
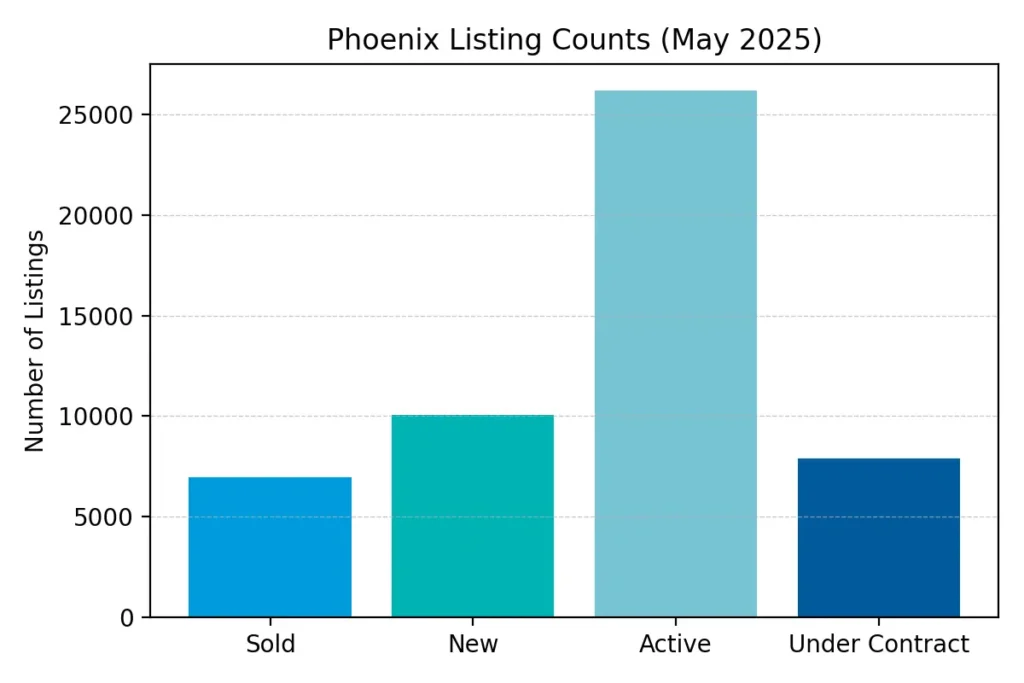
The flow of new listings tells a different story. May brought 10,055 new listings to the MLS, 7.79 % fewer than in April but 32.9 % more than six months earlier. Average list price per square foot on these fresh listings was about $297.51, down 2.05 % from April and 3.88 % from February, while the median list price per square foot fell to $267.67. The reduction in new‑listing pricing suggests sellers are starting to meet the market rather than anchoring to last year’s highs.
Active and pending inventory
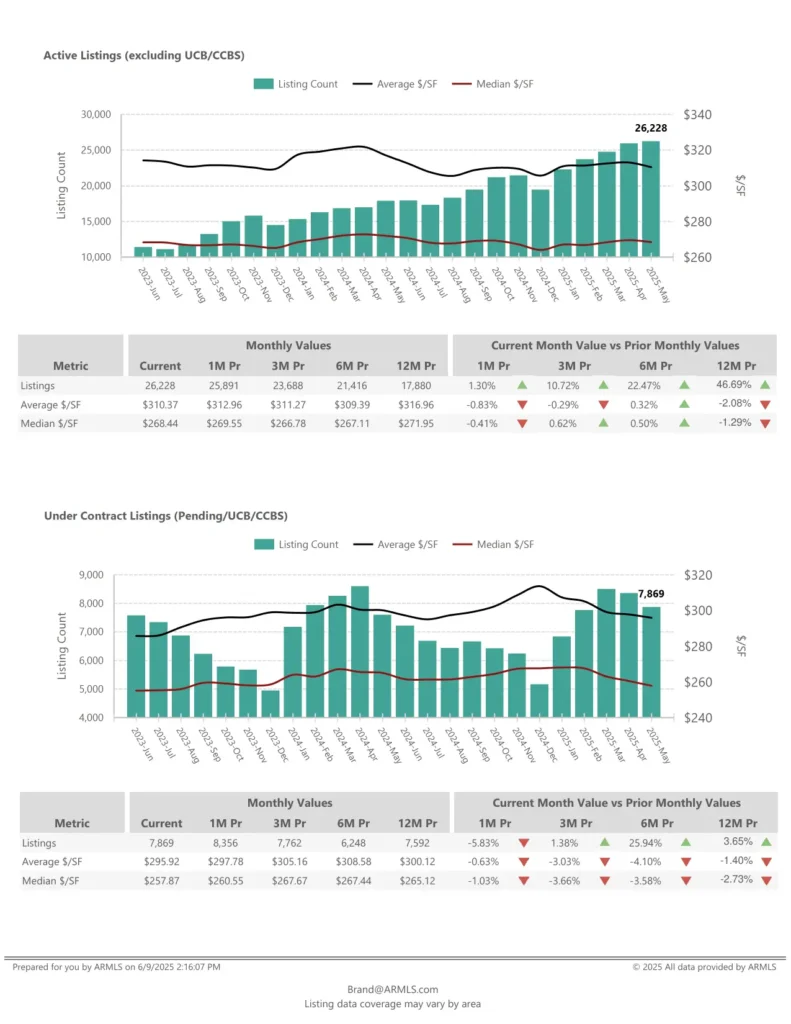
Active inventory (excluding homes under contract) swelled to 26,228 properties, up 46.69 % year‑over‑year. Median asking price per square foot on active listings was $268.44, roughly flat versus three months prior and down 1.29 % from May 2024. Under‑contract inventory tells us about future closings; there were 7,869 homes pending or in UCB/CCBS status, a 5.83 % decline from April but 25.94 % higher than six months ago. The typical pending home commanded about $295.92 per sf, 3.03 % below the three‑month average.
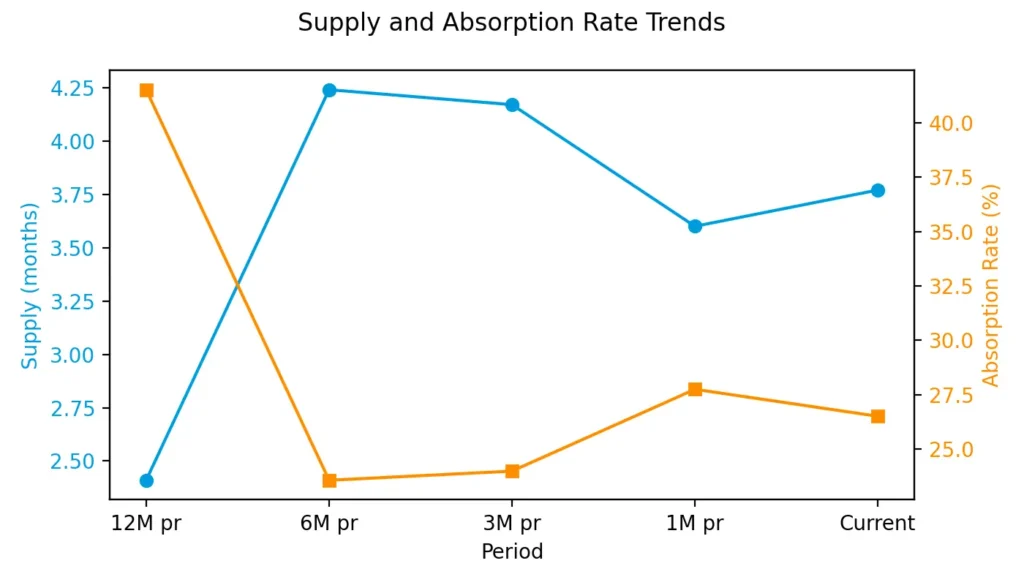
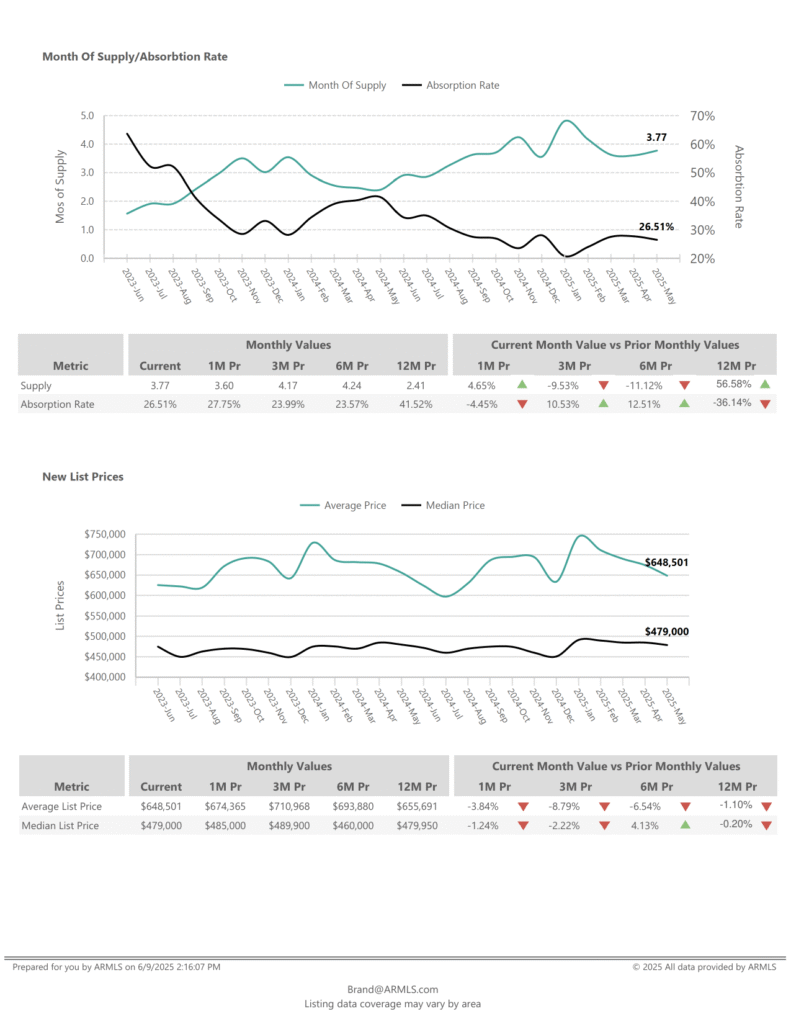
Supply, absorption and pricing
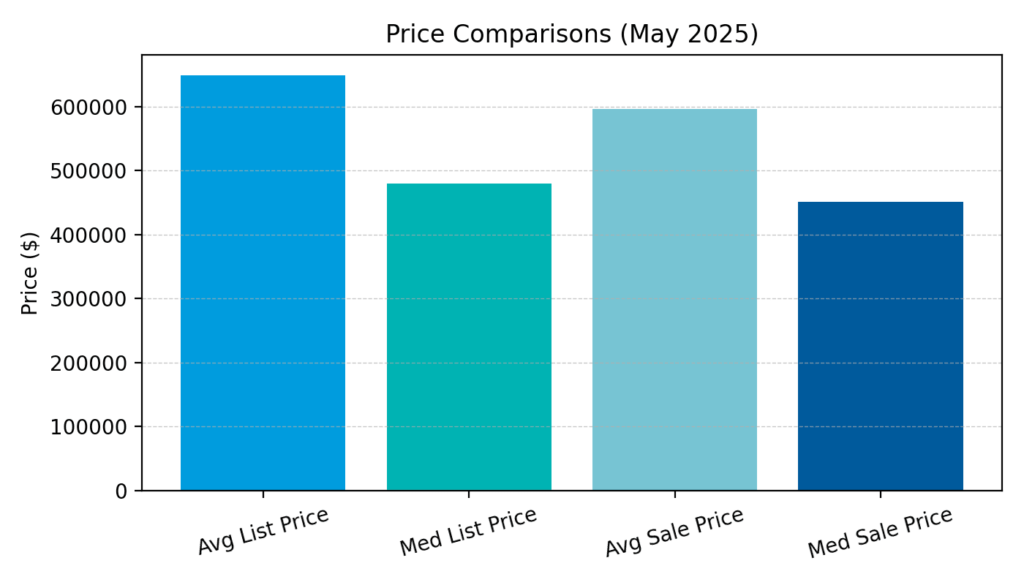
Months of supply climbed to 3.77 months, a 56.58 % jump from the 2.41‑month supply seen in May 2024. The absorption rate—a measure of how quickly inventory is selling—slipped to 26.51 %, well below last year’s 41.52 % and signalling a slower market. Sellers also pulled back on list prices: the average list price was $648,501, down 8.79 % versus February and 1.10 % below last year. The median list price of $479,000 was off 2.22 % from February but essentially flat year‑over‑year.

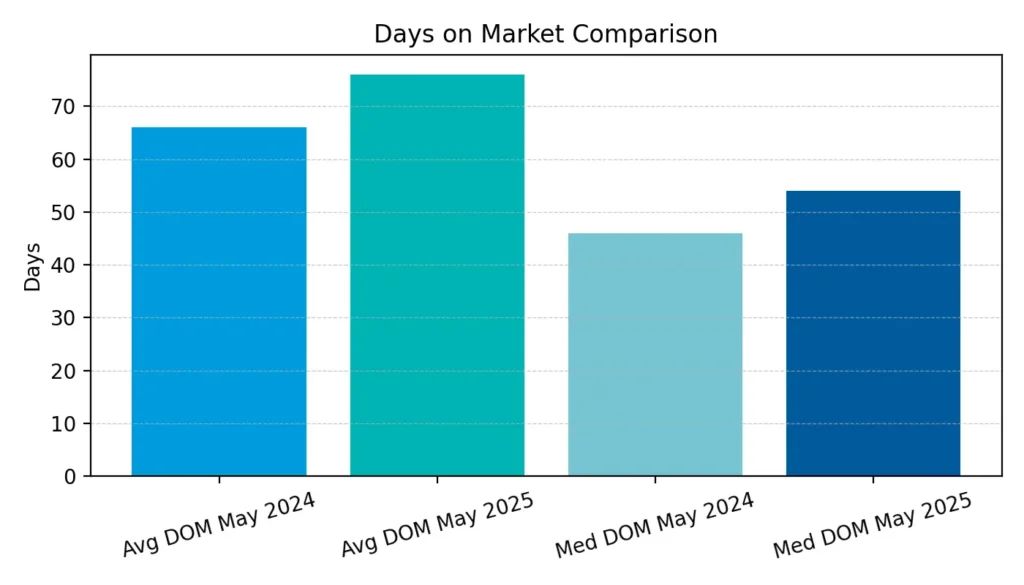
On the sales side, the average sales price reached $595,891, gaining 1.32 % over April and 4.25 % over November 2024. The median sales price was $450,995, edging 1.35 % higher than April and virtually unchanged from a year ago. Days‑on‑market ticked up: the average property took 76 days to sell and the median took 54 days, both roughly two weeks longer than a year earlier.
What the May data tells us
- More homes are sitting on the market. Active listings are up nearly half from last year, and months of supply have increased dramatically. That means buyers have more choices.
- Prices are softening but not collapsing. Median and average sales prices have barely moved year‑over‑year, suggesting sellers are adjusting expectations rather than slashing prices.
- The seller’s advantage has eroded. Absorption rates below 30 % and rising days‑on‑market imply that homes are taking longer to sell and buyers have gained negotiating power.
June 2025 results and July trends
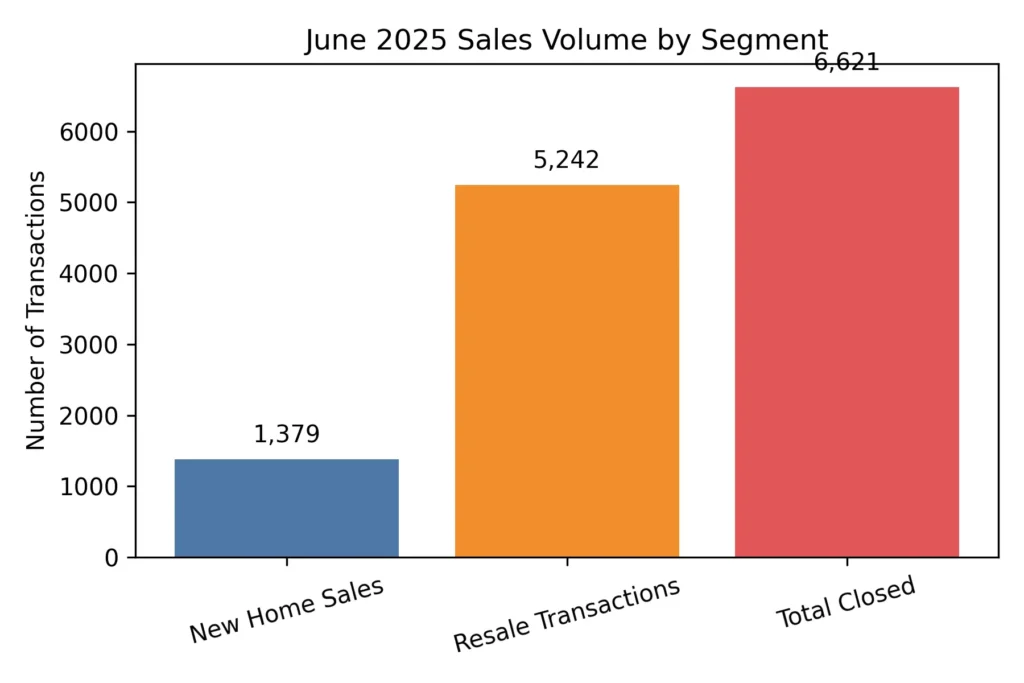
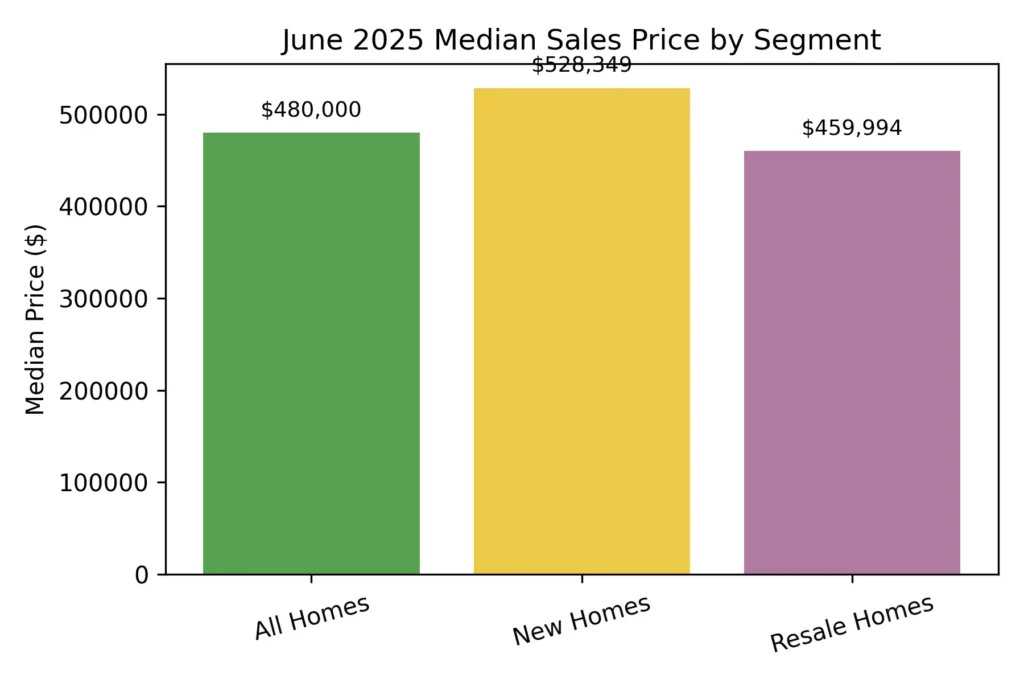
Early July analysis of Maricopa County affidavits of value shows how the market evolved after May. According to a July 7th market update, closed transactions in June totaled 6,621—down 6.5% from May and slightly below June 2024. New home sales slipped to 1,379 units, a 13% year‑over‑year decline, while re‑sale transactions improved 3.8% from last year but fell 6.0% from May. The overall median sales price increased to $480,000, up 1.1% versus June 2024 but down 1.0% from May. Builders continued to raise prices: the new‑home median reached $528,349 (up 4.9% year‑over‑year), while re‑sale median prices declined to $459,994. With more inventory and slower demand, only two cities in the Valley remained in clear seller’s‑market territory; eight were balanced and seven favored buyers.
The Cromford Market Index, an indicator of market balance, has been drifting lower; in early July the average monthly change was –1.7%, an improvement from –2.7% the week before. This suggests that while conditions still favor buyers, the rate of decline is slowing. The same update notes that resale prices down slightly year‑over‑year translate into greater affordability once inflation is considered.
July buyer and seller behaviour
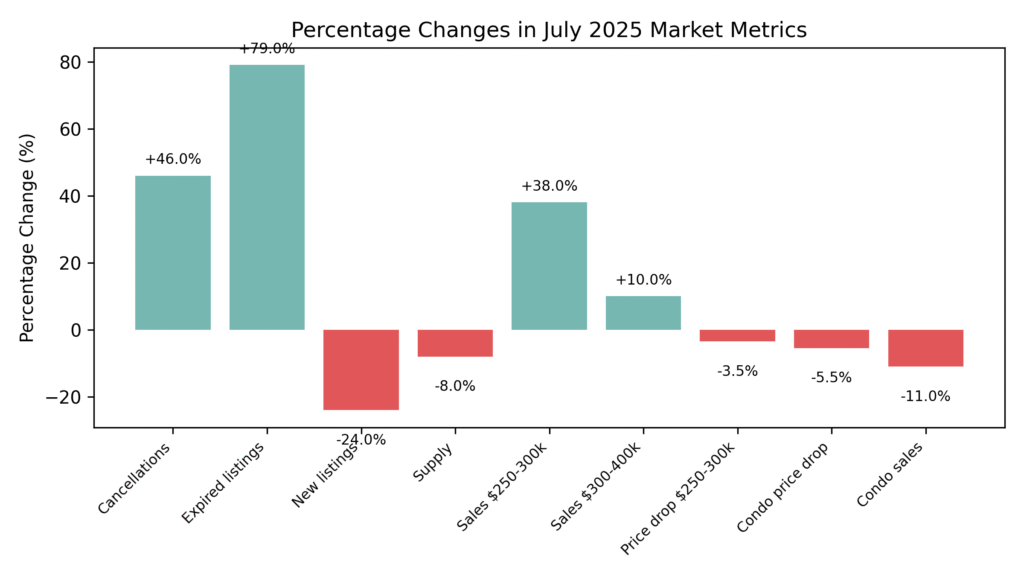
Chad Arend’s July market update highlights how participants are adjusting. Many sellers canceled or allowed their listings to expire at the end of May; cancellations were up 46% and expirations 79% compared with last year. New listings being added to the MLS dropped 24% between Memorial Day and Independence Day, resulting in an 8% decline in supply over just five weeks. Luxury inventory (over $800k) saw the biggest drop, down 14%, which temporarily pushed Paradise Valley back into seller‑market status.
On the buyer side, contracts surged in lower price bands. Sales of single‑family homes between $250k and $300k jumped 38% in June, and those between $300k and $400k rose 10%. Prices in these ranges have fallen roughly 3.5% over the past year, while condo prices dropped 5.5% and sales fell 11%. Sellers continued to concede; 55% of sales closed with sellers contributing a median $10,000 toward buyers’ closing costs, and negotiations averaged 97.1% of list price. Median time to secure a contract shortened to 44 days for single‑family homes but stretched to 59 days for condos.
What this means for buyers
Choice and leverage – With active inventory up significantly and months of supply approaching four, buyers have more options and room to negotiate. Entry-level and mid-tier homes between $250k and $400k have experienced the largest boost in sales volumes, and price declines in these segments make them attractive. However, well-presented homes in desirable neighborhoods still draw quick offers—be ready to act decisively.
Rate environment – Mortgage rates are hovering around 7%. While that feels high relative to the ultra-low rates of 2020–21, it’s in line with long-term averages. According to industry commentary, rates near 7.75% have been typical over the past few decades. Buyers should budget for current rates rather than waiting for the unlikely return of 3% mortgages and consider using rate-buy-down incentives offered by builders.
Negotiation strategy – Buyers are successfully negotiating roughly 3% off list price plus closing-cost credits. In higher price ranges, discounts can be larger. Focus negotiation energy on closing costs, repairs, and upgrades rather than chasing unrealistic price cuts.
What this means for sellers
Price realistically and prepare – The median and average list prices are trending down, and overpriced homes are sitting. Stage your home, address deferred maintenance, and price it based on comparable sales from the last three months rather than last year’s peak. Homes that are turnkey and well‑priced are still attracting strong offers.
Expect concessions – More than half of recent sales involved sellers paying buyer closing costs. Budget for concessions and be open to repairs or credits to keep deals together. If you’re selling in the luxury bracket, be aware that inventory has thinned sharply, but demand is also softer—buyers are negotiating harder on price and terms.
Timing matters – July and August historically bring slower buyer activity due to heat and vacations. If you can’t wait until the fall, be prepared for longer market times (median 54 days for May closings) and more negotiation. Alternatively, consider listing just after Labor Day when buyer demand often rebounds.

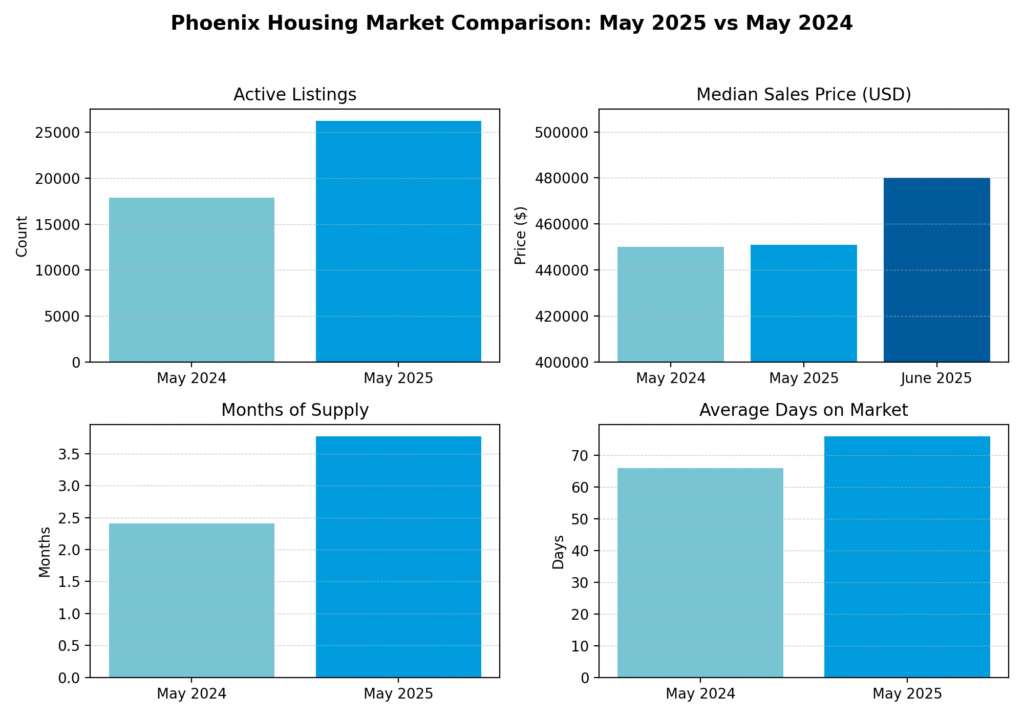
Visualising the shift
Below is a simple infographic comparing key metrics from May 2025 with May 2024, along with the June 2025 median resale price. It illustrates how inventory, supply, pricing and days on market have moved in just one year. You can see that supply and active listings have surged, while prices have barely budged. Even with the June uptick, median sale prices remain within a narrow range.
Conclusion
The Phoenix housing market isn’t crashing; it’s normalizing. May’s ARMLS data shows a balanced market emerging with more supply and longer marketing times, while June closings confirm that buyers still have appetite at the right price. July trends suggest the decline in market strength is slowing, and some sub-markets, particularly luxury areas like Paradise Valley, are already bouncing back. For buyers, the next several months may offer the best combination of selection and bargaining power we’ve seen in years. For sellers, success hinges on realistic pricing, strong presentation, and a willingness to meet the market.