
The Phoenix housing market in November 2025 continues its measured transition toward equilibrium, marked by stable prices, elevated inventory, and a notable uptick in pending sales activity. Building on the patterns established throughout 2025, Greater Phoenix real estate now offers buyers meaningful negotiating power while sellers who price strategically can still achieve successful outcomes. Home prices held steady year-over-year while active listings remained near multi-year highs, creating a market environment that rewards patience and preparation on both sides of the transaction. This report expands on insights from the October 2025 Phoenix Housing Market Report and delivers the latest trends for buyers, sellers, and investors navigating the Greater Phoenix real estate market.
Key Takeaways:
- Median home price: $450,000 (0.0% year-over-year) – the median sales price remains exactly where it stood in November 2024, demonstrating remarkable price stability in a market with abundant inventory.
- Active inventory: ~24,400 homes (+14% year-over-year) – inventory remains substantially elevated versus a year ago, providing buyers with extensive choices, though down slightly from October’s peak.
- Days on market: 59 days median (+13.5% from Nov 2024) – homes are taking about a week longer to sell than they did a year ago, though selling times improved slightly from October.
- Market supply: 4.63 months (+9.1% year-over-year) – months of supply has climbed into balanced territory, with inventory levels that favor neither buyers nor sellers exclusively.
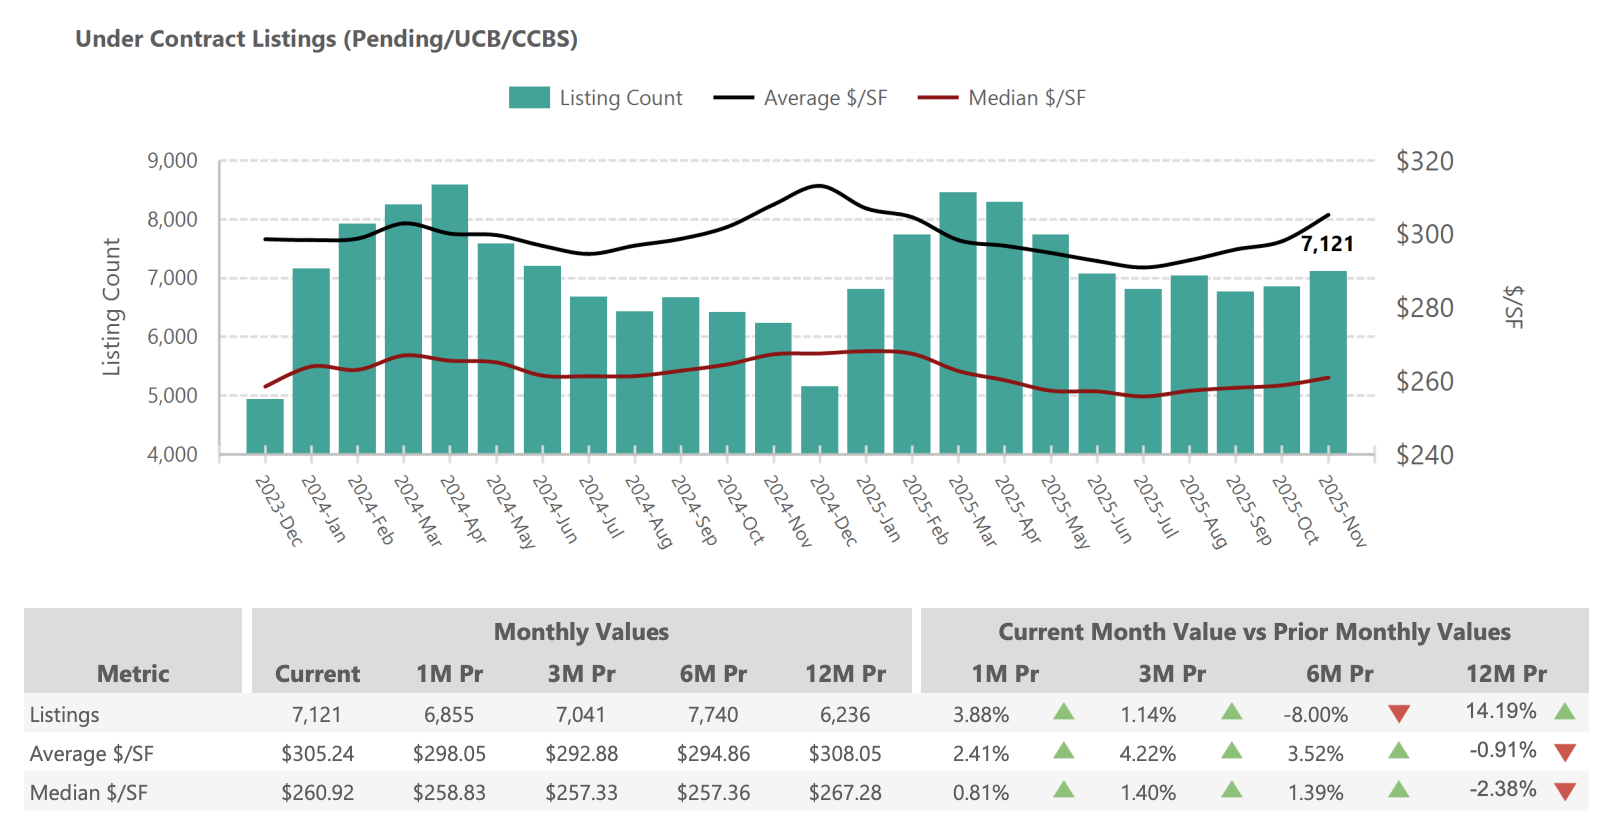
- Pending contracts: 7,121 homes (+14.2% from Nov 2024) – a strong signal of buyer activity, indicating sustained demand despite elevated supply and higher mortgage rates.
📺 Watch the Video Overview
Prefer to watch instead of read? Our November 2025 Phoenix Housing Market video breaks down all the key stats and trends in just a few minutes. See charts, expert commentary, and actionable insights for buyers, sellers, and investors.
Phoenix’s housing market in November 2025 reflects a healthy recalibration from the extremes of recent years. The combination of flat prices, elevated but stabilizing inventory, and improving pending sales suggests a market finding sustainable footing. Buyers benefit from choice and negotiating leverage not seen in nearly five years, while sellers who understand current conditions can still transact successfully. Mortgage rates hovering near 7% continue to moderate some purchasing power, but the Valley’s robust job growth—particularly in healthcare, technology, and advanced manufacturing—sustains housing demand. Greater Phoenix real estate as we close 2025 offers a calmer, more predictable environment where informed decision-making and realistic expectations drive successful outcomes for all market participants.
Phoenix Home Prices November 2025: Stable at the Plateau
1- Current Pricing Trends
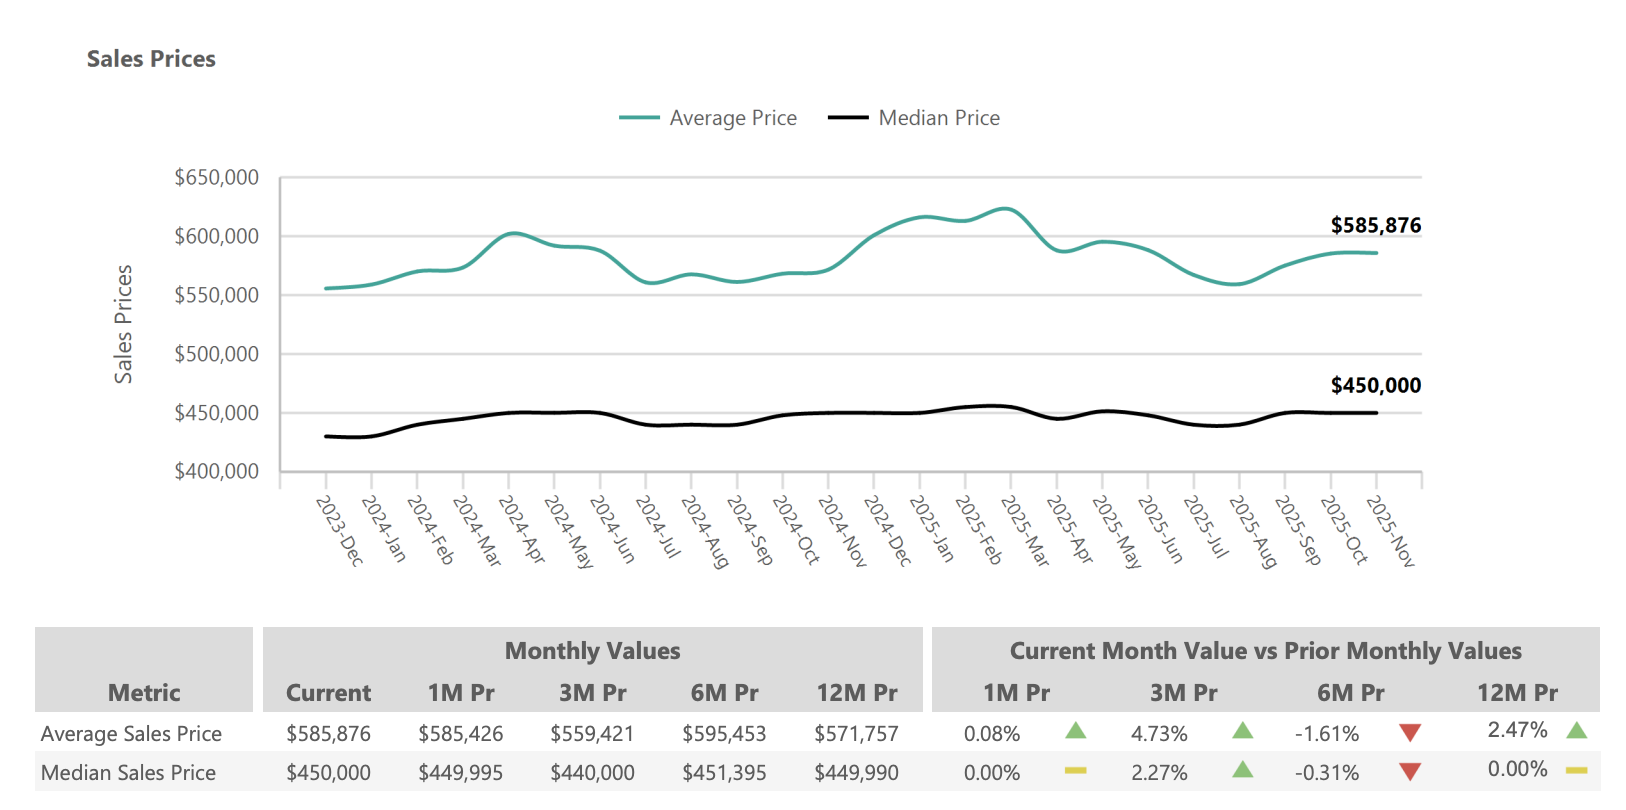
Phoenix home prices demonstrated remarkable stability in November 2025, with the median sales price holding firm at $450,000—exactly unchanged from November 2024. This flat year-over-year performance signals that the market has established a sustainable price floor following the volatility of recent years. The average sales price reached approximately $585,876, up a modest 2.47% from the same period last year, with the higher average partially reflecting continued activity in the luxury segment.
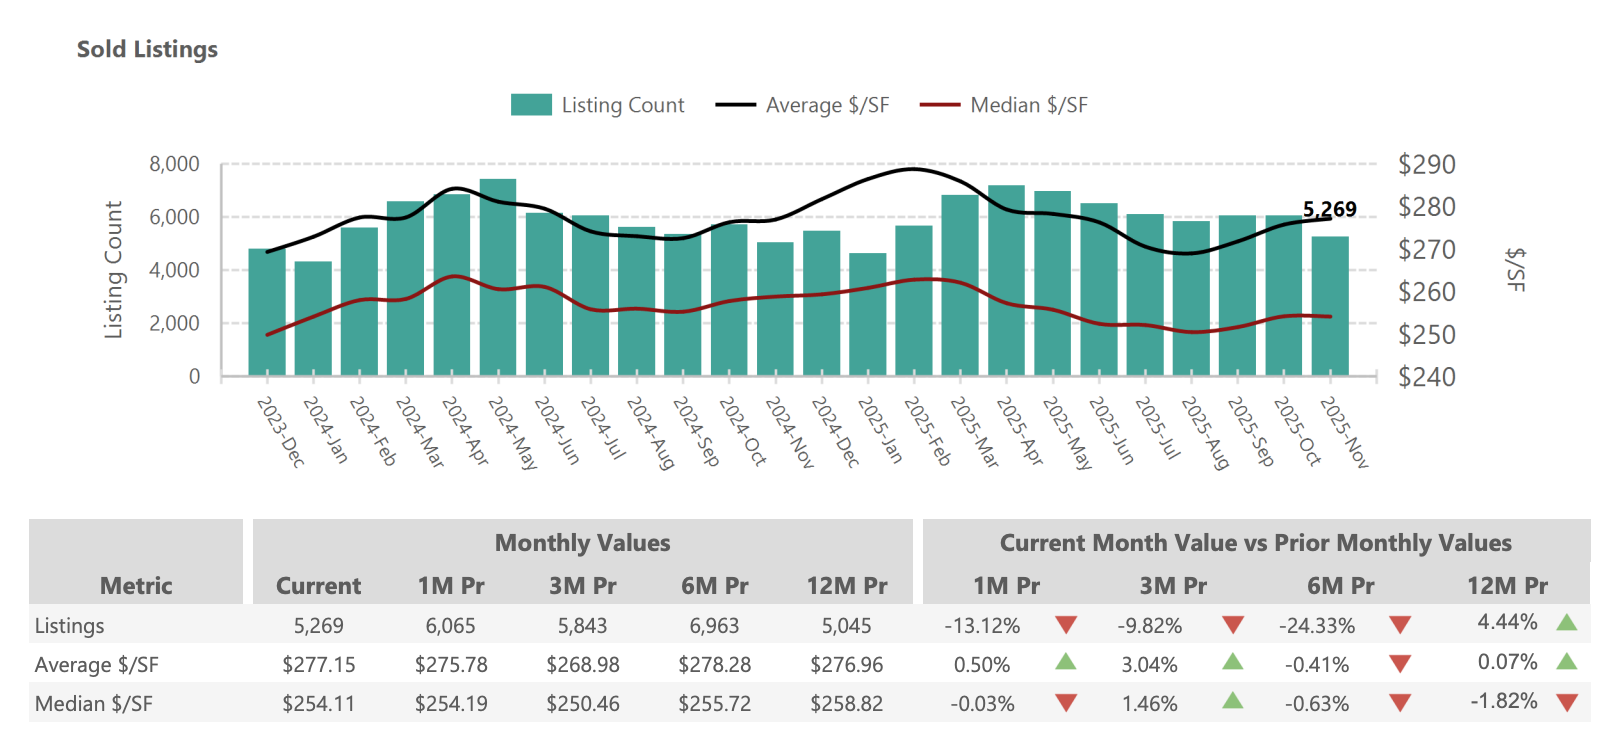
Month-to-month movement was negligible, with November’s median essentially matching October’s $449,995 figure. This consistency through the fall season indicates that buyers and sellers have reached pricing consensus—neither side is gaining significant ground, and transactions are occurring at values both parties consider fair. Price per square foot metrics paint a similar picture: the average sold price per square foot sits at $277.15 (up 0.07% YoY), while the median sold price per square foot is $254.11 (down 1.82% YoY).
The slight divergence between average and median metrics deserves attention. While the median price remained flat, the modest increase in average prices and average price per square foot suggests stronger activity in upper price tiers. Luxury homes in Scottsdale, Paradise Valley, and North Phoenix continue attracting well-qualified buyers, lifting overall averages even as entry-level and mid-market segments experience more muted conditions. For the typical Phoenix homebuyer, however, the message is clear: prices have stabilized, providing a predictable foundation for purchase decisions.
Price Metrics:
- Median Sales Price: $450,000 (0.0% YoY)
- Average Sales Price: $585,876 (+2.47% YoY)
- Price per Square Foot (Sold Homes): $277.15 average (+0.07% YoY), $254.11 median (-1.82% YoY)
- Price per Square Foot (Active Listings): $306.26 average (-0.99% YoY), $261.24 median (-2.20% YoY)
2- Historical Context
The current median price of $450,000 remains approximately 6% below Phoenix’s all-time high of roughly $480,000 reached in May 2022. This represents a remarkably soft landing compared to historical corrections. During the 2008-2011 housing crisis, Phoenix home values plummeted over 50%, devastating homeowners and investors alike. In contrast, the current stabilization reflects a market that overheated and then gently cooled rather than crashed.
Higher mortgage rates beginning in 2022 undoubtedly constrained buyer purchasing power, but they have not triggered the kind of price collapse that some predicted. Instead, the market has experienced what analysts term a “controlled plateau”—prices stopped rising rapidly, corrected modestly from peak levels, and have now stabilized for essentially 12 consecutive months. Looking at the trajectory from late 2024 through November 2025, month-over-month price changes have been minimal, typically within 1-2% in either direction.
Phoenix’s strong fundamentals explain this resilience. Job growth continues at a robust pace, with the metro area adding positions in healthcare, technology, and manufacturing sectors. Population inflows from higher-cost states persist, maintaining baseline demand. And critically, Phoenix never experienced the same degree of speculative overbuilding that preceded the 2008 crash—housing construction, while recovering, still lags behind household formation. These factors have put a floor under prices even as mortgage rates more than doubled from their pandemic-era lows.
3- Local Variations
Price performance varies meaningfully across Greater Phoenix’s diverse submarkets. Higher-priced areas have generally shown more resilience and even modest appreciation, while entry-level markets face greater affordability constraints from elevated interest rates.
Scottsdale and Paradise Valley continue commanding premium prices, with the luxury segment ($1M+) seeing renewed interest from cash buyers and high-income relocators. Median prices in these areas have ticked up 2-4% year-over-year, and well-priced luxury properties can still generate competitive offers. The limited land availability and desirable amenities in these communities support values even when the broader market softens.
Gilbert and Chandler remain popular with families seeking excellent schools and newer construction. Prices in these East Valley communities have held relatively steady, with median values around $550,000-$570,000—flat to slightly down from last year. Inventory has increased more substantially here, giving buyers additional negotiating room.
West Valley communities like Buckeye, Goodyear, and Surprise offer the most affordable entry points in Greater Phoenix, with median prices in the $380,000-$420,000 range. These areas have experienced the most inventory growth and the longest days on market, reflecting affordability pressures as higher rates particularly impact first-time buyers.
Central Phoenix and Tempe show mixed signals depending on specific neighborhoods. Gentrifying areas near downtown Phoenix have maintained values, while some older neighborhoods have seen modest price softening. The urban core’s appeal to young professionals and investors remains strong, though rental market dynamics also influence pricing.
The takeaway for buyers: pricing power varies significantly by location. Those shopping in the West Valley or older East Valley neighborhoods may find sellers more willing to negotiate, while buyers targeting Scottsdale or new Gilbert construction should expect less flexibility. Understanding these micro-market dynamics is essential for crafting competitive offers.
Phoenix Housing Inventory November 2025: Abundant but Stabilizing
1- Inventory Trends and Analysis
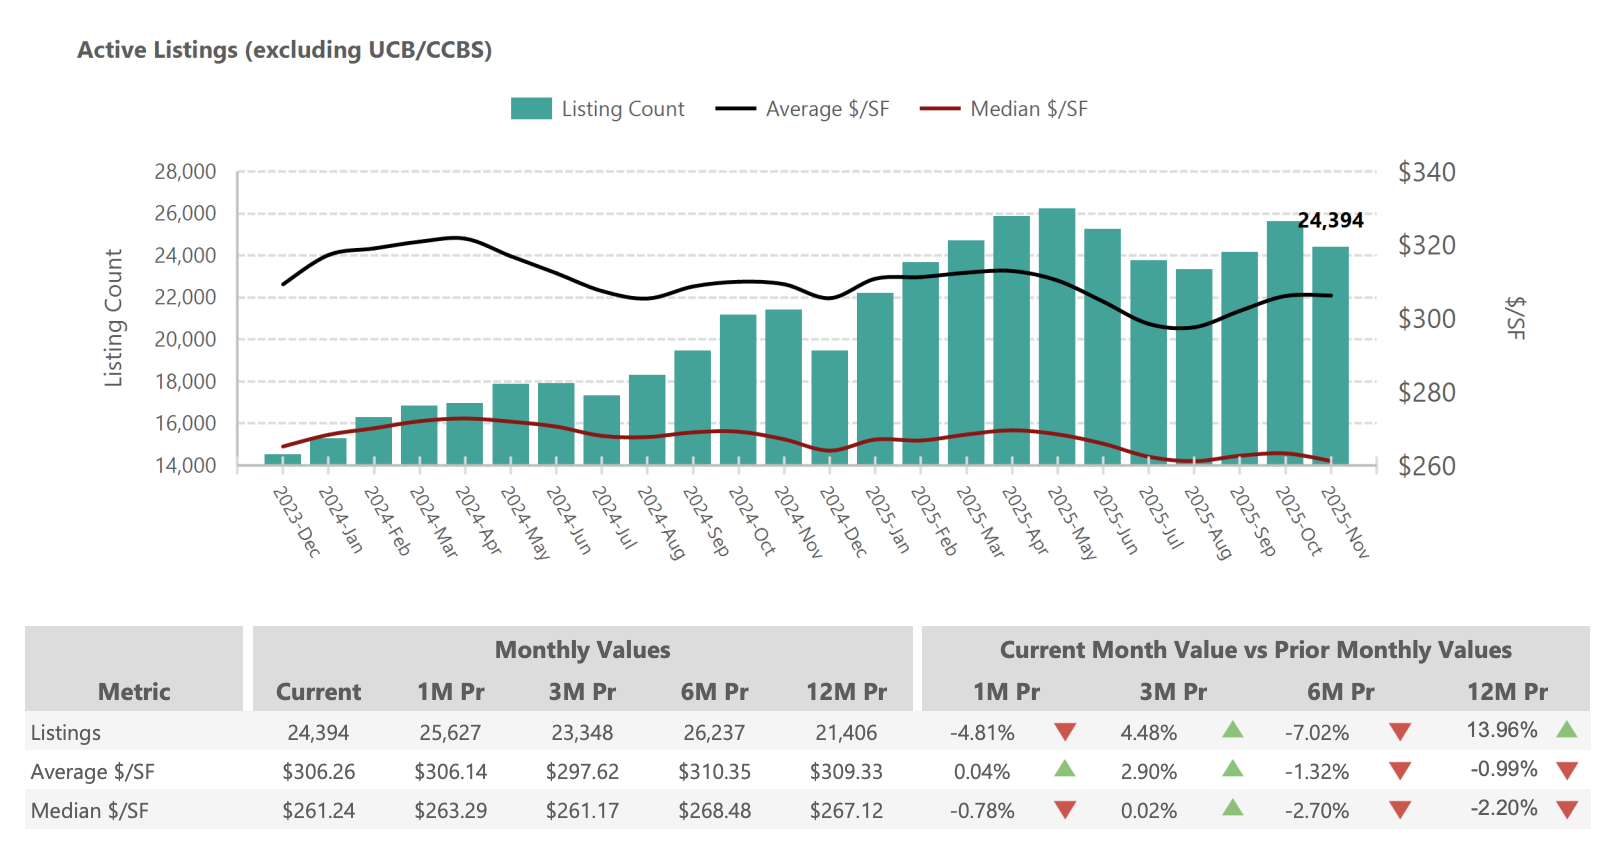
Active inventory in November 2025 reached approximately 24,394 homes for sale across Greater Phoenix—up 14% from November 2024’s count of roughly 21,400, but down about 5% from October 2025’s peak near 25,600. This pattern suggests the inventory surge that characterized much of 2024 and early 2025 may be stabilizing, with supply and demand finding a new equilibrium.
Buyers now have access to more homes than at any time since 2014-2015, fundamentally transforming the shopping experience. The scarcity-driven frenzy of 2021-2022, when buyers competed fiercely for a handful of listings, has given way to a market where choice abounds. Today’s buyer can view a dozen homes over several weekends, carefully compare features and pricing, and select a property that genuinely meets their needs rather than settling for “whatever is available.”
Several factors drove this inventory expansion. New listing activity throughout 2025 outpaced 2024 by roughly 8-10%, as more homeowners—including some who had been “locked in” by low mortgage rates—decided to sell due to life changes (job relocations, family growth, retirement). New construction also contributed meaningfully; builders delivered thousands of homes in 2025, adding fresh supply to the market. Finally, slower sales absorption meant listings accumulated rather than being quickly purchased, building the inventory pile.
Inventory Metrics:
- Active Listings: 24,394 homes (+13.96% YoY, -4.81% from Oct)
- New Listings (Added in Nov): 7,331 (-3.00% YoY, -28.67% from Oct)
- Months of Supply: 4.63 months (+9.11% YoY)
- Absorption Rate: 21.60% (-8.35% YoY)
2- Seasonal Patterns and New Listing Activity
The November data reflects typical seasonal patterns, with new listing activity declining significantly from October. The 7,331 new listings in November represent a 28.67% decrease from October’s 10,278 new listings—an expected seasonal slowdown as the holidays approach and fewer homeowners choose to list during the winter months.
Year-over-year, November 2025’s new listing count was down 3% from November 2024, suggesting that the wave of new supply that characterized earlier 2025 may be moderating. This could signal improving conditions for sellers: if new supply continues to slow while demand remains steady, the supply-demand balance could shift back toward sellers in 2026.
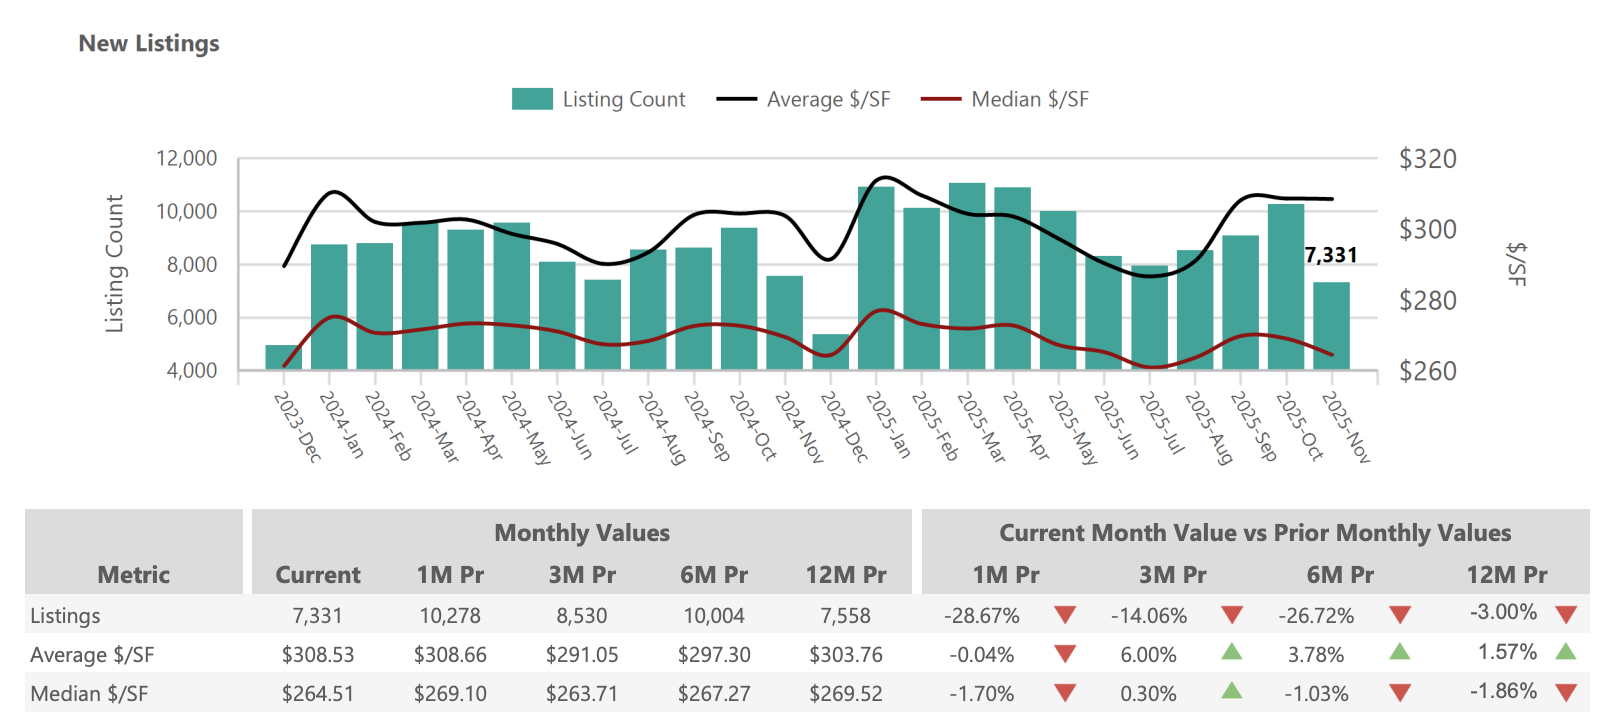
The average list price for November’s new listings stood at $707,363 (up 2.03% YoY), while the median list price was $465,000 (up 1.09% YoY). These figures slightly exceed sold prices, reflecting the typical spread between asking and final sale prices in the current market. Sellers are pricing with some negotiating room built in, recognizing that most buyers will offer below list price.
3- Supply and Demand Balance
The 4.63 months of supply in November 2025 represents a significant shift from the sub-2 month levels seen during the pandemic housing boom. Real estate economists generally consider 4-6 months of supply indicative of a balanced market, where neither buyers nor sellers hold dominant negotiating power. Phoenix has now firmly entered this balanced territory.
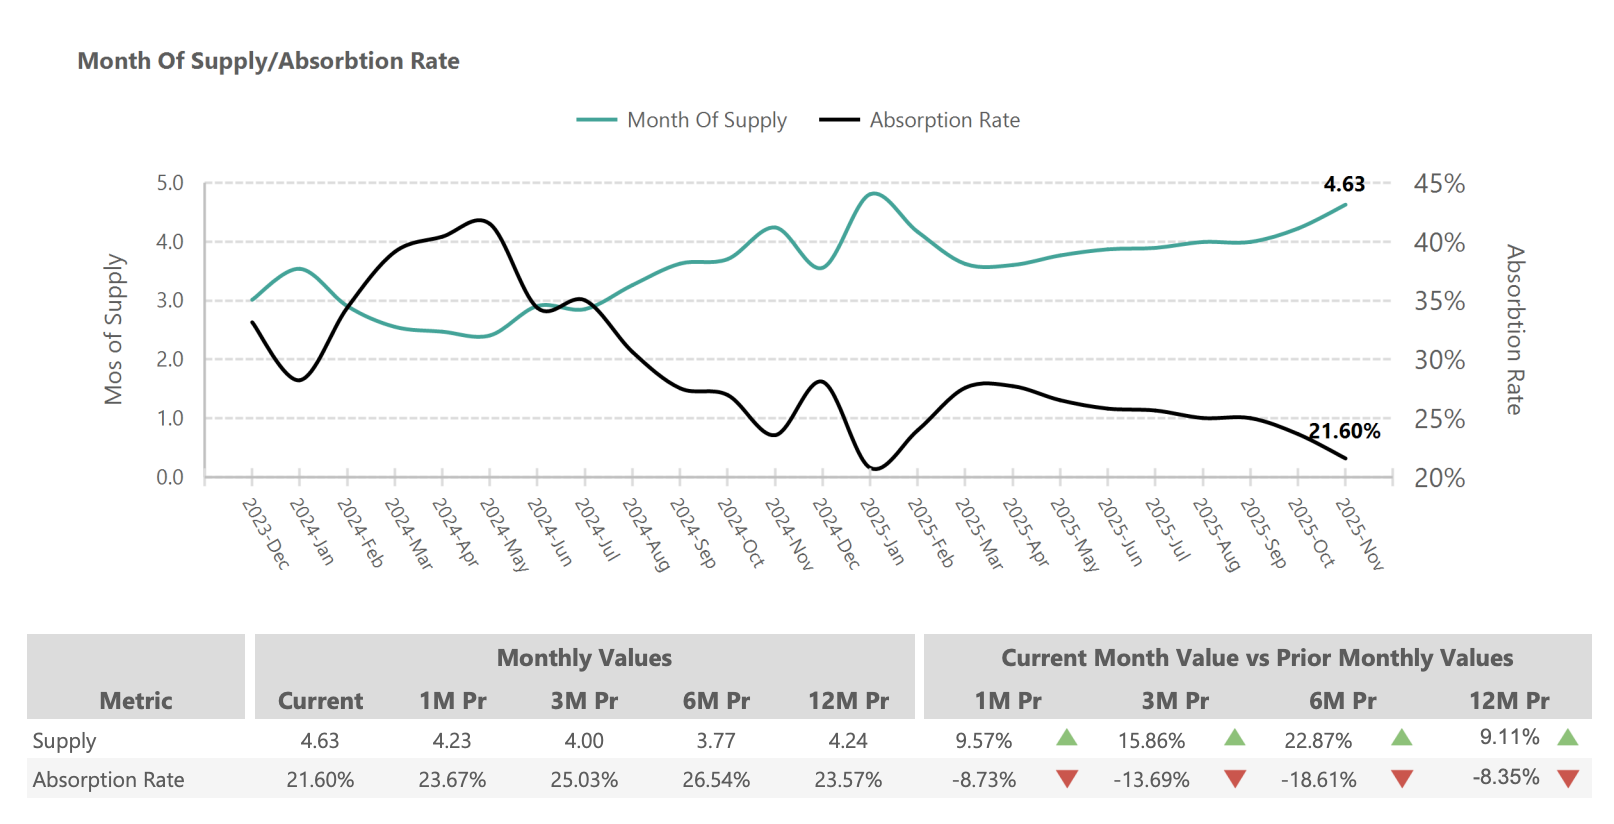
The absorption rate of 21.60% means roughly one in five active listings sold during November. This is down from approximately 23.6% a year ago, confirming that homes are taking longer to find buyers. For context, during the frenzy market of 2021, absorption rates often exceeded 50%, with half of all available inventory selling each month. Today’s more measured pace gives both buyers and sellers time to make considered decisions.
Importantly, the elevated inventory has not caused price collapse precisely because demand remains fundamentally sound. Phoenix continues attracting relocators from California, the Pacific Northwest, and the Midwest. Job growth supports household formation. And despite higher rates, monthly mortgage payments on a median-priced Phoenix home remain lower than equivalent rent in many cases, supporting purchase decisions.
4- Sold Listings: Steady Transaction Volume
November 2025 saw 5,269 closed sales, up 4.44% from November 2024’s 5,045 closings. This modest increase in sales volume—despite higher inventory and elevated rates—demonstrates sustained buyer activity. The market isn’t stagnant; transactions are happening at a healthy clip, just without the frantic pace of the pandemic era.
The under-contract (pending) count of 7,121 homes provides an even more optimistic signal. This figure is up 14.19% from November 2024, suggesting that buyer activity accelerated heading into the holiday season. These pending sales should translate to closed transactions in December 2025 and January 2026, potentially providing a strong start to the new year.
Neighborhood Spotlight: How Different Areas Are Performing
Greater Phoenix encompasses dozens of distinct communities, each with its own market dynamics. Understanding these local variations helps buyers identify opportunities and sellers set realistic expectations. Here’s how key submarkets performed in November 2025.
Scottsdale: Luxury Resilience
Scottsdale continues commanding premium prices, with the luxury segment showing particular strength. Median home prices in Scottsdale hover around $860,000-$1.1 million depending on the specific area, with North Scottsdale’s luxury enclaves pushing even higher. The market for homes above $2 million has actually seen renewed interest from cash buyers and high-net-worth individuals relocating from California and the Northeast.
Days on market in Scottsdale average 56-64 days, slightly below the metro average, indicating that buyers remain active in this desirable market. Inventory has increased here as well, but the combination of limited land availability, top-rated schools, and resort-style amenities continues supporting values. Sellers of well-maintained properties in premium Scottsdale locations still enjoy relatively strong positioning.
Gilbert: Family-Focused Stability
Gilbert remains one of the Valley’s most sought-after family communities, known for excellent schools, master-planned neighborhoods, and convenient East Valley location. The median home price sits around $561,000-$570,000, reflecting modest year-over-year softening of 1-3% depending on the specific subdivision.
This community has seen meaningful inventory growth, with active listings up more substantially than the metro average. Buyers shopping in Gilbert have significantly more options than a year ago, particularly in the new construction segment where builders have delivered substantial inventory. Days on market average 54 days, slightly faster than metro, suggesting continued demand despite the expanded supply.
Chandler: Tech Corridor Strength
Chandler benefits from its proximity to major employers including Intel, and the broader semiconductor industry expansion. The median price hovers around $535,000-$560,000, with newer sections commanding premiums. Employment stability in the tech sector provides demand support even as the broader market has cooled.
The market here shows similar patterns to Gilbert: elevated inventory, longer selling times than 2021-2022, but fundamentally sound demand from relocating professionals and growing families. Homes near the Intel campus and other major employers tend to sell somewhat faster than those in more distant locations.
Mesa: Value-Oriented Opportunity
Mesa offers some of the Valley’s best value, with a median price around $436,000-$472,000—well below the metro median. This affordability attracts first-time buyers and investors seeking better cash flow metrics. However, Mesa has also experienced significant inventory accumulation and longer selling times.
Days on market in Mesa average 63-68 days, above the metro median, and the market runs at approximately 3.5 months of supply. Buyers shopping in Mesa have substantial negotiating leverage, particularly on older inventory that’s been listed for 45+ days. For price-conscious buyers willing to trade location premium for square footage and value, Mesa presents compelling opportunities.
West Valley: Entry-Level Focus
Communities like Buckeye, Goodyear, Surprise, and Peoria offer the Valley’s most affordable entry points, with median prices ranging from $380,000 to $440,000. These areas have experienced the most dramatic inventory growth and longest days on market, reflecting the acute affordability challenges that higher interest rates create for entry-level buyers.
First-time buyers dependent on financing at 7% rates face payment challenges that didn’t exist at 3% rates, dampening demand in precisely these affordable markets. Investors may find opportunities here, acquiring rental properties at attractive prices with strong rental demand from those unable to purchase. Sellers in the West Valley should price aggressively and expect longer selling timelines than their East Valley counterparts.
Central Phoenix and Tempe: Urban Dynamics
The urban core presents mixed conditions depending on specific neighborhoods. Gentrifying areas near downtown Phoenix—Roosevelt Row, Coronado, Willo—have maintained values as young professionals and empty-nesters seek walkable urban living. Tempe, with its proximity to ASU and strong rental market, continues attracting investor interest.
Condos and townhomes in these areas face more challenging conditions than single-family homes, with inventory elevated and days on market extended. The urban rental market remains strong, supporting investor purchases even as retail buyer activity has moderated. For buyers seeking urban lifestyle at reasonable prices, the current market offers opportunities not available during the frenzied years.
Economic Drivers: Why Phoenix Real Estate Remains Resilient
Understanding the economic forces supporting Phoenix’s housing market helps explain why prices have stabilized rather than crashed despite dramatically higher interest rates and expanded inventory. Several key factors continue underpinning housing demand.
Employment Growth Continues
The Phoenix metro area added jobs throughout 2025, with employment now exceeding 2.4 million positions. Year-over-year job growth of 1.2-1.5% outpaces most major metros, providing the income growth that supports housing purchases. The unemployment rate remains at a healthy 3.1%—among the lowest in the nation.
Key growth sectors include healthcare (now representing 14% of metro employment, up from 8% before the Great Recession), professional and business services, technology, and construction. The healthcare sector alone has added tens of thousands of positions as the growing population requires expanded medical infrastructure. Each new hospital, clinic, and medical office brings doctors, nurses, technicians, and administrators who need housing.
The Semiconductor Boom
Phoenix has emerged as a crucial node in the nation’s semiconductor manufacturing renaissance. TSMC’s massive fabrication facilities in North Phoenix represent the largest foreign investment in Arizona history, with the first facility now operational and additional fabs under construction. Intel continues expanding its Chandler campus. These investments create high-paying jobs—semiconductor engineers, technicians, and support staff—who become home buyers.
The ripple effects extend beyond the fabs themselves. Suppliers, service providers, and related businesses are establishing Phoenix operations. Housing demand from this sector should persist and grow as production ramps up through 2026 and beyond. Communities nearest these facilities—North Phoenix, Gilbert, Chandler—benefit most directly.
Population Growth Persists
Greater Phoenix’s population now exceeds 4.8 million, having grown by nearly 2 million people over the past 25 years. While the torrid growth rates of 2020-2022 have moderated, inflows continue—particularly from California, Washington, Illinois, and New York. The metro area consistently ranks among the nation’s fastest-growing, adding household formation that creates baseline housing demand.
What attracts relocators? Relative affordability compared to coastal cities, favorable business climate, warm weather (despite increasingly intense summers), and expanding job opportunities. A California household selling a $1.5 million Bay Area home can purchase a substantially larger Phoenix property with cash to spare. This migration pattern has persisted for decades and shows no signs of stopping.
The Water Question
No discussion of Phoenix’s long-term housing outlook would be complete without addressing water. The June 2023 groundwater management decision limited new development in areas dependent on unreplenished groundwater, affecting primarily far-flung suburban developments. This constraint may ultimately support existing home values by limiting future supply growth.
However, established communities with access to Colorado River water, Salt River Project water, and recharged groundwater face less immediate concern. Phoenix proper, Scottsdale, Tempe, Mesa, Chandler, and Gilbert all have secured water supplies for existing development. Buyers should understand water sourcing when purchasing, particularly in newer outlying subdivisions. The water situation adds complexity but hasn’t derailed the market—if anything, it may constrain future supply in ways that support prices for existing homes.
Days on Market: Finding the Right Buyer Takes Time
1- Current Selling Timeframes
Homes in Phoenix are taking longer to sell than they did a year ago, though November showed slight improvement from October. The median days on market (DOM) reached 59 days, up from 52 days in November 2024—a 13.46% increase. The average DOM sits at 84 days, up 16.67% from 72 days a year prior.
These extended timelines represent a fundamental shift from the frenetic pace of 2021-2022, when well-priced homes often received multiple offers within 48 hours. Today’s market rewards patience: buyers can thoroughly evaluate properties, and sellers should expect a multi-week or multi-month marketing period before finding the right buyer.
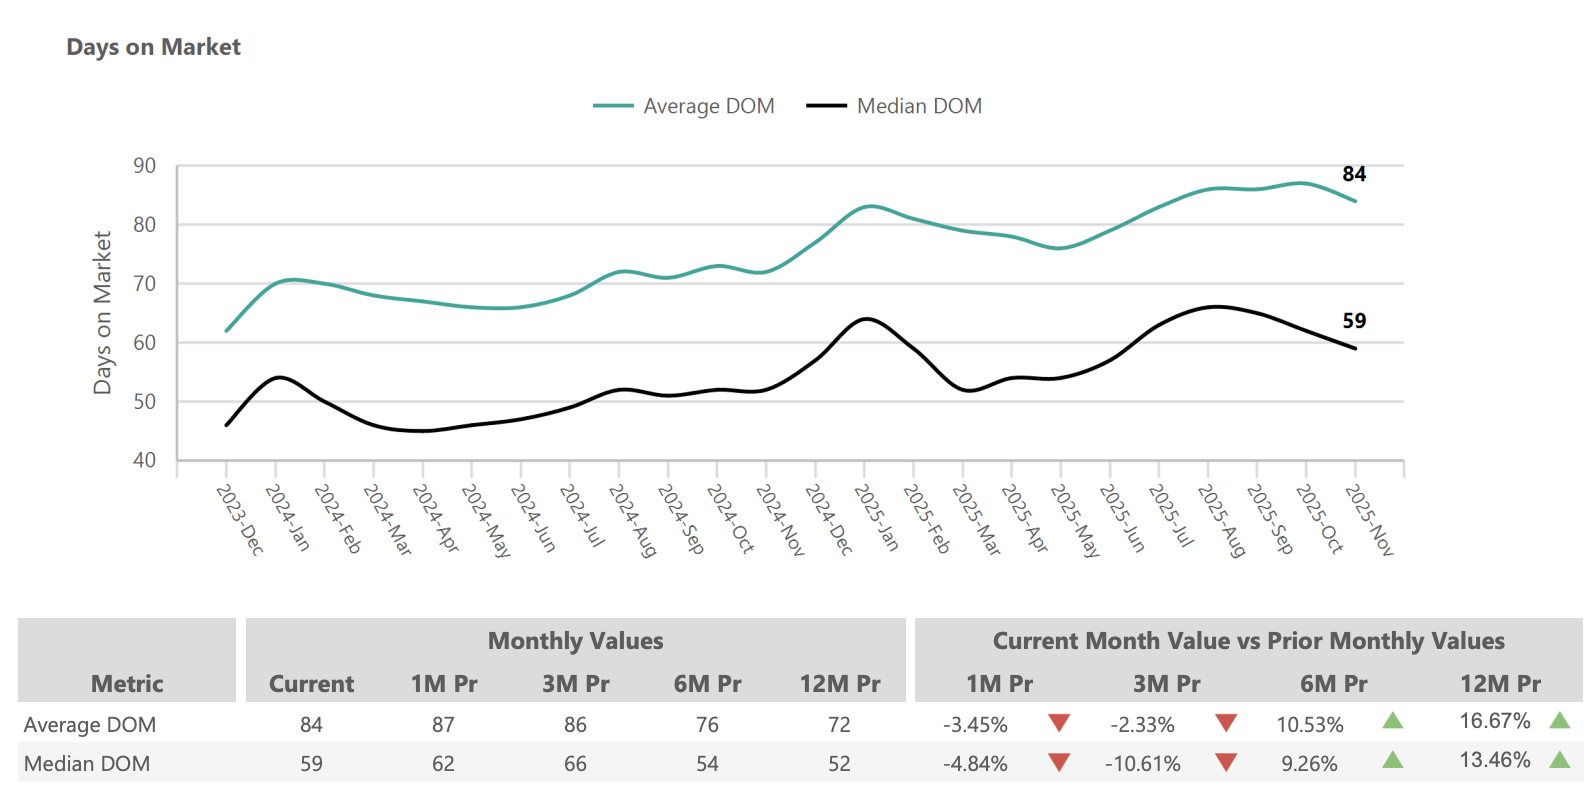
Notably, November’s DOM figures improved slightly from October (median 62 days, average 87 days), suggesting some seasonal acceleration as motivated buyers sought to close before year-end. This pattern typically reverses in December and January when holiday distractions slow activity.
Days on Market Data:
- Median DOM: 59 days (was 52 days in Nov 2024, +13.46% YoY)
- Average DOM: 84 days (was 72 days in Nov 2024, +16.67% YoY)
- Month-over-month: Improved from October (median 62 days → 59 days)
2- Market Psychology and Buyer Behavior
The extended selling times reflect a profound shift in market psychology. Buyers no longer feel the panic-driven urgency that characterized the pandemic housing market. With 24,000+ homes available, there’s always another option if today’s showing doesn’t feel right. This psychological comfort allows buyers to be more selective, more likely to include contingencies, and more willing to negotiate on price and terms.
Sellers have had to recalibrate expectations significantly. The assumption that a weekend open house would yield multiple competing offers is no longer valid for most properties. Instead, sellers must prepare for an extended marketing period—potentially 2-3 months—and maintain their home in showing condition throughout. Price reductions after 30-60 days without offers have become commonplace, as sellers who initially priced optimistically adjust to market feedback.
This slower pace produces some positive outcomes. Buyers who proceed with a purchase have typically conducted thorough due diligence, reducing the likelihood of buyer’s remorse or contract fallout. Transactions that do occur tend to close successfully because both parties had adequate time to evaluate and commit. The frenzy-era problems of waived inspections, buyer regret, and cancelled contracts have largely subsided.
3- What Sells Quickly vs. What Lingers
Not all properties experience the same selling timeline. Properties that sell within 30 days typically share common characteristics: competitive pricing (at or slightly below recent comparable sales), excellent condition (updated, move-in ready), desirable locations (good schools, convenient commutes), and strong marketing (professional photography, strategic online presence).
Properties that linger for 60+ days often suffer from one or more challenges: overpricing relative to condition or location, deferred maintenance or dated finishes that discourage buyers, challenging locations (busy streets, commercial adjacency, inferior school districts), or marketing that fails to showcase the home’s best features.
For sellers, the lesson is clear: invest in preparation and pricing strategy. A well-prepared, competitively priced home can still attract offers within weeks, even in this market. But hoping that buyers will overlook flaws or overpay for perceived value is a recipe for extended market time and eventual price reductions.
Actionable Advice for Market Participants
The November 2025 data confirms that Phoenix has entered a genuinely balanced market—the first such environment in nearly five years. With approximately 24,400 active listings, a median price holding steady at $450,000, and homes taking a median of 59 days to sell, neither buyers nor sellers hold overwhelming advantage. In this environment, success depends on understanding current dynamics and adapting strategy accordingly. Below are practical, data-backed recommendations for buyers, sellers, and investors in Greater Phoenix.
For Buyers
Opportunities in the Current Market
- Unprecedented Selection and Negotiating Power: With inventory up 14% year-over-year and over 24,000 homes available, buyers enjoy the widest selection in over a decade. This abundance transforms the house-hunting experience. Rather than competing fiercely for a handful of listings, you can tour multiple properties, compare features and pricing, and identify homes that genuinely meet your needs. The 59-day median DOM indicates sellers aren’t receiving instant offers, giving you leverage to negotiate more assertively on homes that have lingered—requesting below-asking prices, seller concessions, or favorable terms.
- Price Stability Reduces Urgency: The median price has held at $450,000 for essentially 12 months. Unlike 2021-2022, when prices rose 15-25% annually and waiting meant paying substantially more, today’s stable prices allow for thoughtful decision-making. You can include inspection and appraisal contingencies, take time for due diligence, and walk away from deals that don’t feel right—all without fear that prices will run away from you. This doesn’t mean expecting dramatic discounts; well-priced homes in good condition still sell near asking price. But it does mean you can shop strategically rather than desperately.
Strategic Recommendations for Buyers
- Get Your Financing Ready: Even in a buyer-friendly market, desirable homes attract interest. A mortgage pre-approval positions you to act decisively when you find the right property. Pre-approval also clarifies your budget, preventing wasted time viewing homes outside your price range. With rates near 7%, work with your lender to understand all financing options, including rate buydowns that sellers might fund as part of negotiations.
- Target Motivated Sellers: Prioritize listings with 30+ days on market or recent price reductions. These sellers have likely received feedback that their initial pricing was optimistic and may be more flexible on terms. With an absorption rate of only 21.6%, many listings aren’t selling immediately—these represent negotiating opportunities. An offer 3-5% below asking on a 45-day-old listing, coupled with a request for seller-paid closing costs, has a reasonable chance of acceptance.
- Include Contingencies: The days of waiving inspections to compete are largely over. Include standard inspection and appraisal contingencies to protect yourself. If issues emerge during inspection, you have leverage to request repairs or credits. Sellers in this market are generally willing to address reasonable concerns rather than risk losing a qualified buyer and returning to active status.
- Consider Seller Concessions: Rather than focusing solely on purchase price, consider asking sellers to contribute toward closing costs or mortgage rate buydowns. A seller who won’t budge on price might agree to contribute $10,000-$15,000 toward buying down your interest rate for the first two years. This can significantly reduce your monthly payment and make the home more affordable, effectively achieving a better deal without reducing the headline price.
- Be Patient but Prepared: Take advantage of the breathing room this market provides. View multiple properties, compare neighborhoods, and ensure you’re making the right decision. That said, when you find a home that checks your boxes at a fair price, be ready to make a strong, clean offer. Well-priced, move-in-ready homes in desirable areas can still attract multiple interested parties. Balance patience with decisiveness.
For Sellers
Current Market Realities
- Competition Is Real: With 24,400+ active listings, your home is competing against substantial inventory. Buyers have choices, and they’re exercising them. Properties that are overpriced, poorly presented, or in challenging locations will be passed over in favor of better options. The 4.63 months of supply means your home represents one of roughly five months’ worth of options for buyers—you must stand out to attract attention.
- Expect Longer Timelines: Plan for a 60-90 day marketing period rather than the week-long selling times of the pandemic era. This means budgeting for additional mortgage payments, maintaining the home in showing condition for months, and managing the psychological stress of extended market exposure. Some homes sell faster; many take longer. Setting realistic timeline expectations from the start reduces frustration.
- Buyers Have Leverage: Today’s buyers feel empowered to negotiate. Expect offers below your asking price and requests for concessions (closing cost contributions, repairs, rate buydowns). The 21.6% absorption rate means most listings don’t sell in any given month, and buyers know this. They’ll submit offers that reflect their understanding of market conditions. Successful sellers meet buyers partway rather than rigidly holding firm.
Success Strategies for Sellers
- Price Competitively from Day One: This is the single most important factor in selling successfully. Study recent comparable sales—not listings, but actual closed transactions from the past 90 days—and price at or slightly below that level. The first 2-3 weeks of market exposure are crucial; overpricing during this window means missing serious buyers who move on to better-valued options. A home priced right from the start typically sells faster and for more money than one that’s overpriced, sits, and eventually requires reductions.
- Invest in Presentation: In a market with abundant competition, your home must show well. Declutter, deep clean, and address deferred maintenance before listing. Consider professional staging if the home is vacant or has dated décor. Invest in high-quality photography—most buyers encounter your listing online first, and poor photos mean missed showings. Highlight features that differentiate your property: updated kitchen, new HVAC, solar panels, pool, mountain views. Give buyers reasons to choose your home over the alternatives.
- Be Flexible on Terms: If your home has been on the market for 30+ days without offers, be prepared to adjust. This might mean a price reduction of 2-3%, offering to pay buyer closing costs, providing a home warranty, or contributing to a rate buydown. These concessions can make your property more attractive without necessarily reducing your net proceeds dramatically. A $10,000 concession that secures a sale beats months of additional carrying costs waiting for a full-price offer that never comes.
- Prepare for Inspection Negotiations: Today’s buyers include inspection contingencies, and they use them. After the inspection report arrives, expect requests for repairs or credits. Rather than viewing this as an affront, approach it as normal business. Address legitimate safety issues and significant mechanical concerns. For cosmetic items, consider offering a credit rather than making repairs yourself. The goal is reaching closing, not winning every negotiation point.
For Investors
Market Opportunities
- More Inventory Means Better Deal Flow: The inventory surge creates opportunities that didn’t exist during the scarcity-driven market. You can identify motivated sellers, negotiate favorable prices, and acquire properties that meet your investment criteria. Institutional buyers have pulled back, reducing competition for individual investors. Properties that might have attracted 10 offers in 2021 now receive 2-3, allowing for more selective acquisition.
- Steady Rental Demand: Phoenix’s rental market remains robust, supported by population growth and job creation. Many would-be buyers, priced out by higher rates or unable to accumulate down payments, are renting instead. Vacancy rates remain low, and rents have held steady or increased modestly. For buy-and-hold investors, this means reliable cash flow from acquired properties.
- Price Stability Enables Underwriting: With prices flat year-over-year, you can underwrite acquisitions with greater confidence. You’re not buying at a speculative peak, and there’s no expectation of rapid appreciation to bail out a marginal deal. Instead, focus on cash flow fundamentals: can the property generate positive returns at current prices and current rents, with conservative assumptions about expenses and vacancy? If yes, the investment makes sense regardless of short-term price movements.
Risk Management for Investors
- Account for Higher Financing Costs: Interest rates near 7% significantly impact investment returns. Run your numbers with current rates, not hoped-for future rates. Consider fixed-rate financing to lock in costs and protect against further rate increases. If using adjustable or interest-only loans, have a clear strategy for when rates adjust. Build in margin for error—if the deal only works with 100% occupancy and below-market expenses, it’s probably too tight.
- Plan for Longer Holding Periods: If your strategy involves flipping, budget for extended selling times. Assume 90+ days from listing to closing when calculating carrying costs. The quick-flip environment of 2021 doesn’t exist today. Consider having a rental backup plan: if the flip doesn’t sell quickly, can you rent it profitably while waiting for better market conditions?
- Focus on Fundamentals: In a balanced market, successful investors return to basics. Target properties with strong rental demand (good locations, appropriate unit sizes, competitive rents). Avoid speculative bets on rapid appreciation. Conduct thorough due diligence—inspect carefully, verify expenses, understand the rental market in the specific submarket. The investors who will thrive are those who buy right and manage well, not those hoping market appreciation will cover mistakes.
- Consider Emerging Submarkets: While established areas like Scottsdale command premium prices, emerging neighborhoods may offer better returns. Areas like South Phoenix, West Valley communities, and portions of Mesa are seeing investment interest due to lower entry prices and improving demographics. Research carefully—not all affordable areas are good investments—but don’t automatically dismiss emerging markets.
The Mortgage Rate Factor: Context for Current Conditions
No analysis of today’s housing market would be complete without addressing the elephant in the room: mortgage interest rates. Rates hovering near 7% for a 30-year fixed mortgage represent a fundamental shift from the 3% rates available in 2021. This single factor explains much of the market’s transformation from frenzied seller’s market to balanced conditions.
Consider the math: On a $450,000 home with 20% down payment, a 3% mortgage meant a principal and interest payment of approximately $1,520 per month. At 7%, that same loan requires about $2,395 monthly—a 57% increase in payment. This payment shock has reduced purchasing power across the market, particularly for first-time buyers and those at the margins of affordability.
The rate environment creates a bifurcated buyer pool. Cash buyers and those with substantial equity from previous home sales face less constraint; they’re competing for luxury properties and driving the relative strength in upper price tiers. Meanwhile, payment-sensitive buyers—first-timers, young families stretching to afford a home—have pulled back, explaining the softness in entry-level markets.
Looking forward, rate direction will significantly influence market trajectory. If the Federal Reserve begins cutting rates in 2026 and mortgage rates decline to the 6% range, expect renewed buyer activity and potential price appreciation. If rates remain elevated or increase further, extended balanced conditions are likely. Most economists project gradual rate improvement through 2026, which would provide tailwind to the Phoenix market. However, timing remains uncertain, and buyers should make decisions based on current conditions rather than hoped-for future improvements.
For those purchasing now, remember: you marry the house but date the rate. A home bought at today’s prices with today’s rates can be refinanced when rates decline. You cannot, however, retroactively capture lower prices if the market appreciates. For those in strong financial positions who find the right property, current conditions may prove advantageous in hindsight.
Conclusion: Balance Brings Opportunity
The Phoenix housing market in November 2025 represents a healthy equilibrium—a welcome stabilization following years of volatility. The combination of flat prices, elevated inventory, and improving pending sales suggests a market that has found sustainable footing. Neither the frenzied seller’s market of 2021-2022 nor a distressed buyer’s market, today’s Greater Phoenix real estate environment rewards preparation, patience, and informed decision-making.
Key Market Themes:
- Stability Over Volatility: The era of 20% annual price swings is behind us. Month-to-month and year-over-year price changes are minimal, providing predictability for planning.
- Choice Over Scarcity: Buyers can select from 24,000+ homes rather than fighting over a handful of listings. This choice leads to better matches between buyers and properties.
- Strategy Over Speed: Success now depends on competitive pricing, excellent presentation, and thoughtful negotiation—not simply being fastest with the highest offer.
- Balance Over Extremes: Neither side dominates negotiations. Buyers and sellers must find middle ground, resulting in fairer transactions for all.
Phoenix’s fundamental strengths remain intact. Job growth continues across healthcare, technology, and manufacturing sectors. Population inflows persist, though at more moderate rates than the pandemic peak. The housing shortage that developed over decades of underbuilding has not been fully addressed, providing underlying support for values. And the metro’s relative affordability compared to California, the Pacific Northwest, and other major markets continues attracting relocators.
Looking toward 2026, most analysts expect continued stability rather than dramatic swings. Prices are likely to remain flat or appreciate modestly. Inventory may stabilize or decline slightly as new listing activity normalizes. Days on market should remain elevated compared to the frenzy years but could improve if mortgage rates moderate. The key variable remains interest rates: meaningful rate declines would boost affordability and likely accelerate buyer activity, while sustained high rates would extend current balanced conditions.
For buyers, this environment offers the opportunity to purchase without panic—to choose a home that truly fits your needs, conduct thorough due diligence, and negotiate fair terms. For sellers, success requires realistic pricing and professional presentation, but well-prepared properties continue to sell. For investors, the market rewards disciplined fundamentals over speculation.
For personalized insights or guidance on navigating this market, reach out to the Phoenix real estate experts at PhoenixHomes.com. Our team stays current on the latest data and can help you craft the right strategy—whether you’re timing a sale for optimal results, negotiating your next home purchase, or building an investment portfolio in Greater Phoenix. The market has changed, but with the right knowledge and experienced partners, your real estate goals remain achievable.