
Phoenix’s housing market continued to normalize in July 2025. Data from the ARMLS STAT report – which tracks sales, listings, and pricing across the metro area – show that activity cooled from the frenzied post-pandemic peaks but remains healthier than a year ago. Nationally, the U.S. market is also rebalancing: July median list prices were $439,450 and price cuts occurred on 20.6% of listings, marking the first month-over-month drop in price reductions in 2025. Buyers across the country have more choices as active listings rose for the 21st straight month, although inventory growth is slowing. Closer to home, Phoenix inventory is up nearly 50% year-over-year while mortgage rates hover around 6.8%. Below, we break down July’s numbers for sold and new listings, supply and pricing, and highlight what the shifting landscape means for buyers and sellers in metro Phoenix.
Visual summary: key metrics at a glance
Sometimes it helps to see the data all in one place. The charts below condense July’s numbers into easy‑to‑digest visuals. They compare listing counts across segments, illustrate how price per square foot varies by listing type and show the shifting relationship between months of supply and the absorption rate. Together, these graphics paint a clear picture of where the market stands.
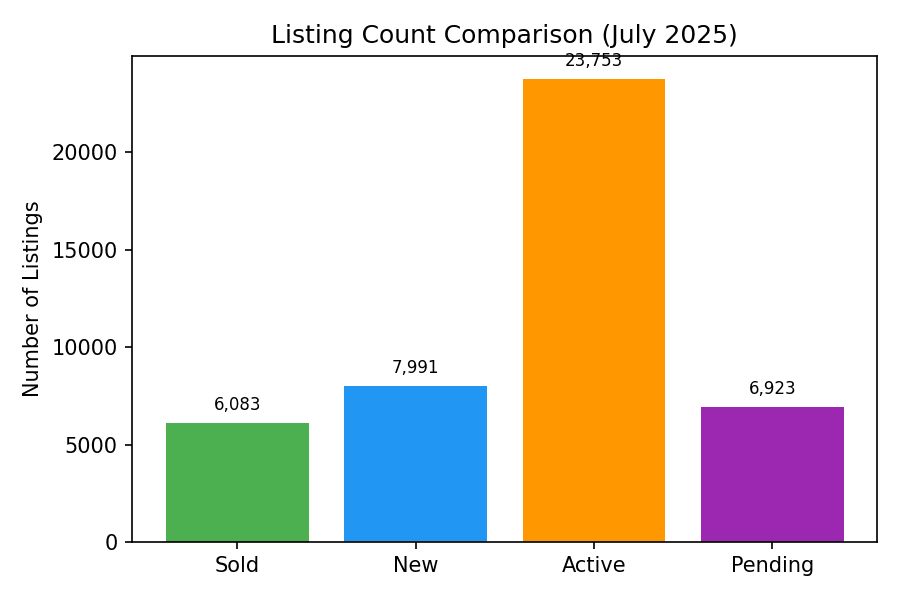
1- Listing counts by segment (July 2025)
Active listings far exceed other categories, while sold and pending totals sit close together, underscoring that a significant portion of inventory is still working through the pipeline.
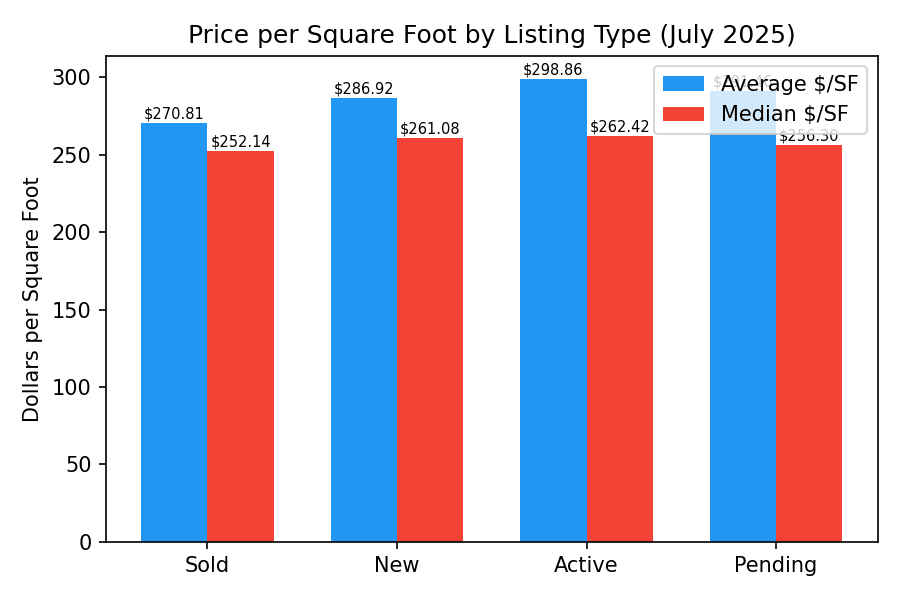
2- Price per square foot by listing type
Active listings command the highest average $/SF, reflecting the premium that sellers hope to achieve. Sold and pending transactions cluster in the $256–$292 range, while median figures run slightly lower, showing where deals are actually closing.
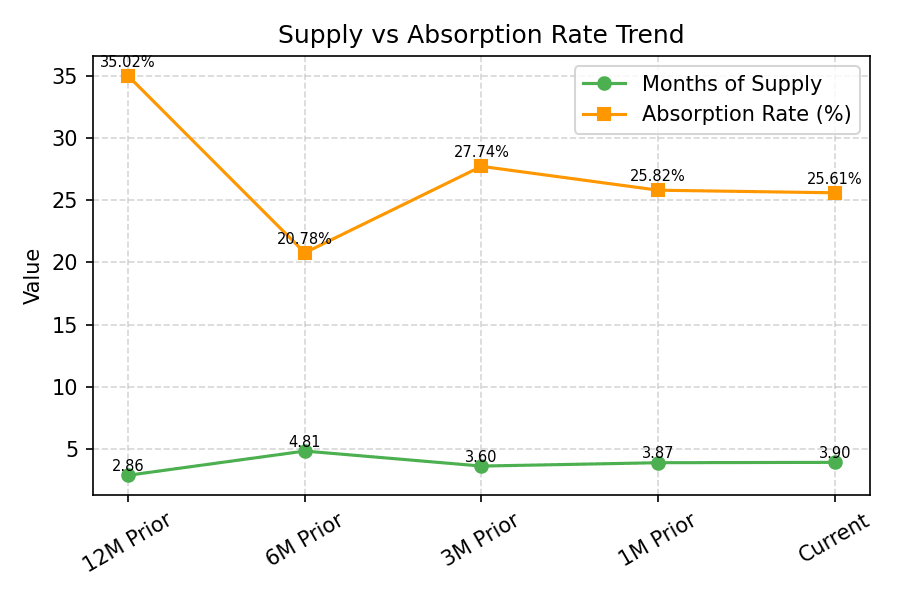
3- Supply vs. absorption rate trend
Supply has trended upward since late 2023, even as the absorption rate has drifted lower. The crossover illustrates the market’s shift from a tight seller’s market toward a more balanced environment.
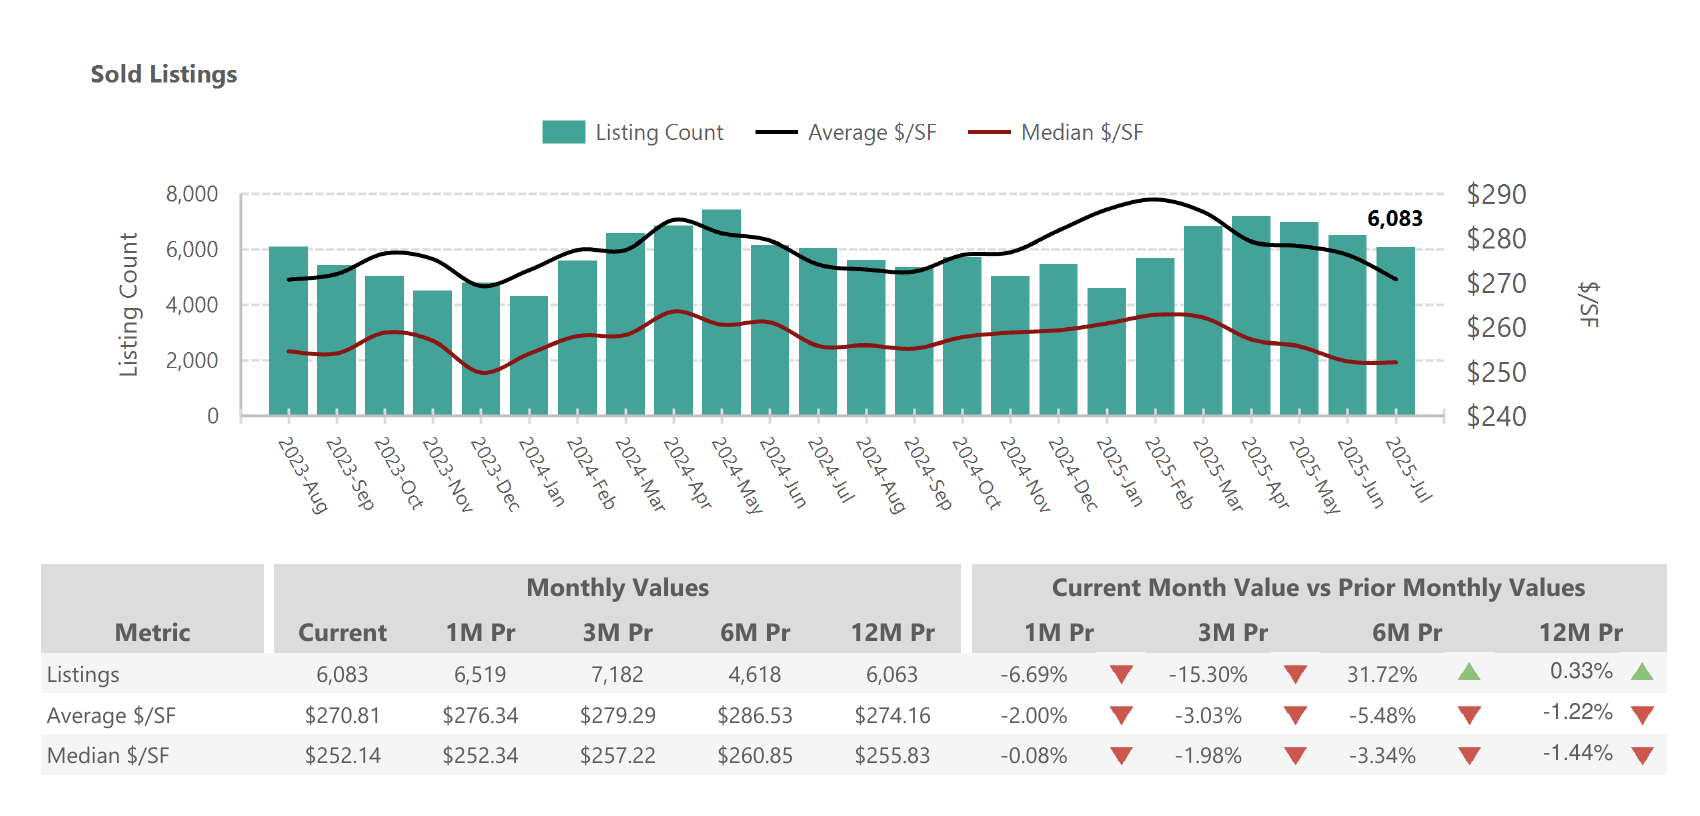
Sold listings: count and price per square foot
1- Sold listings
6,083 homes closed in July (down 6.7 % from June but roughly flat compared with July 2024). Volume had jumped 31.7 % since January but tapered off as summer set in.
2- Average $/SF
Homes sold for $270.81 per square foot on average. That’s 2.0 % lower than last month and down 1.2 % from a year ago. Average $/SF peaked near $286 in early spring.
3- Median $/SF
The typical home sold for $252.14 per square foot. Median pricing was essentially unchanged from June and down about 1.4 % year‑over‑year.
Slowing sales and slight price softening reflect rising mortgage rates and seasonal cooling. Properties that are turnkey and well‑priced still move quickly; overpriced or dated homes sit longer and often require price reductions.
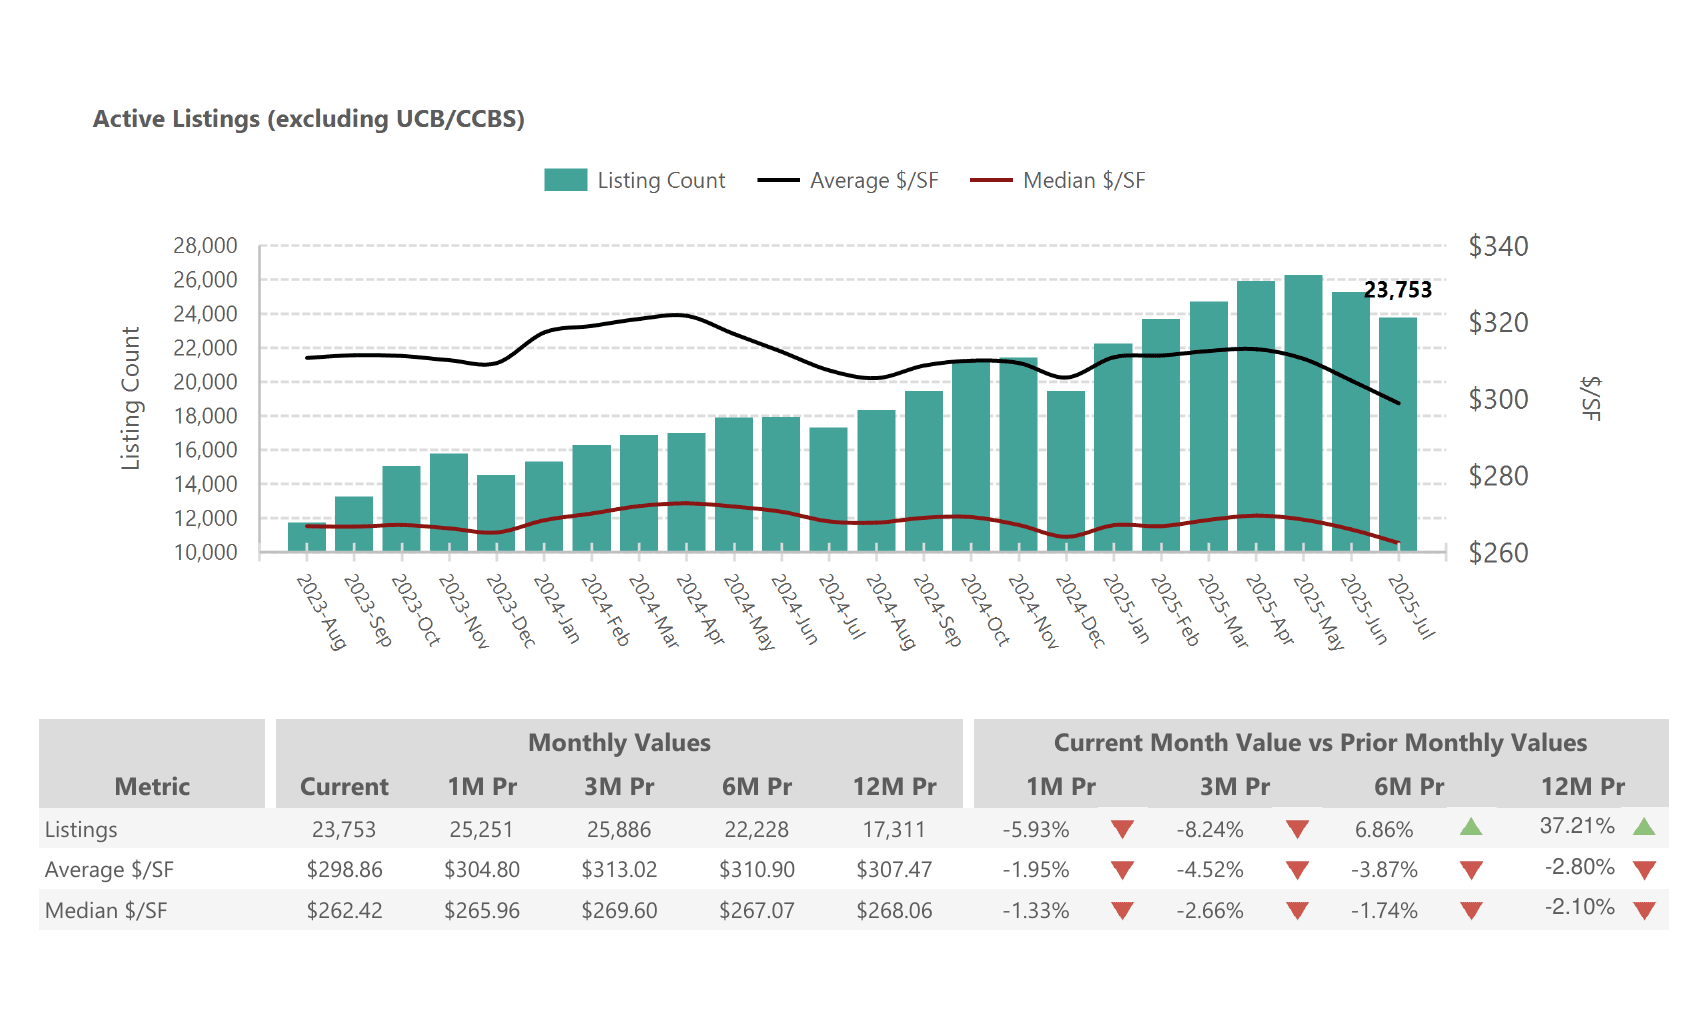
New and active listings: inventory shifts
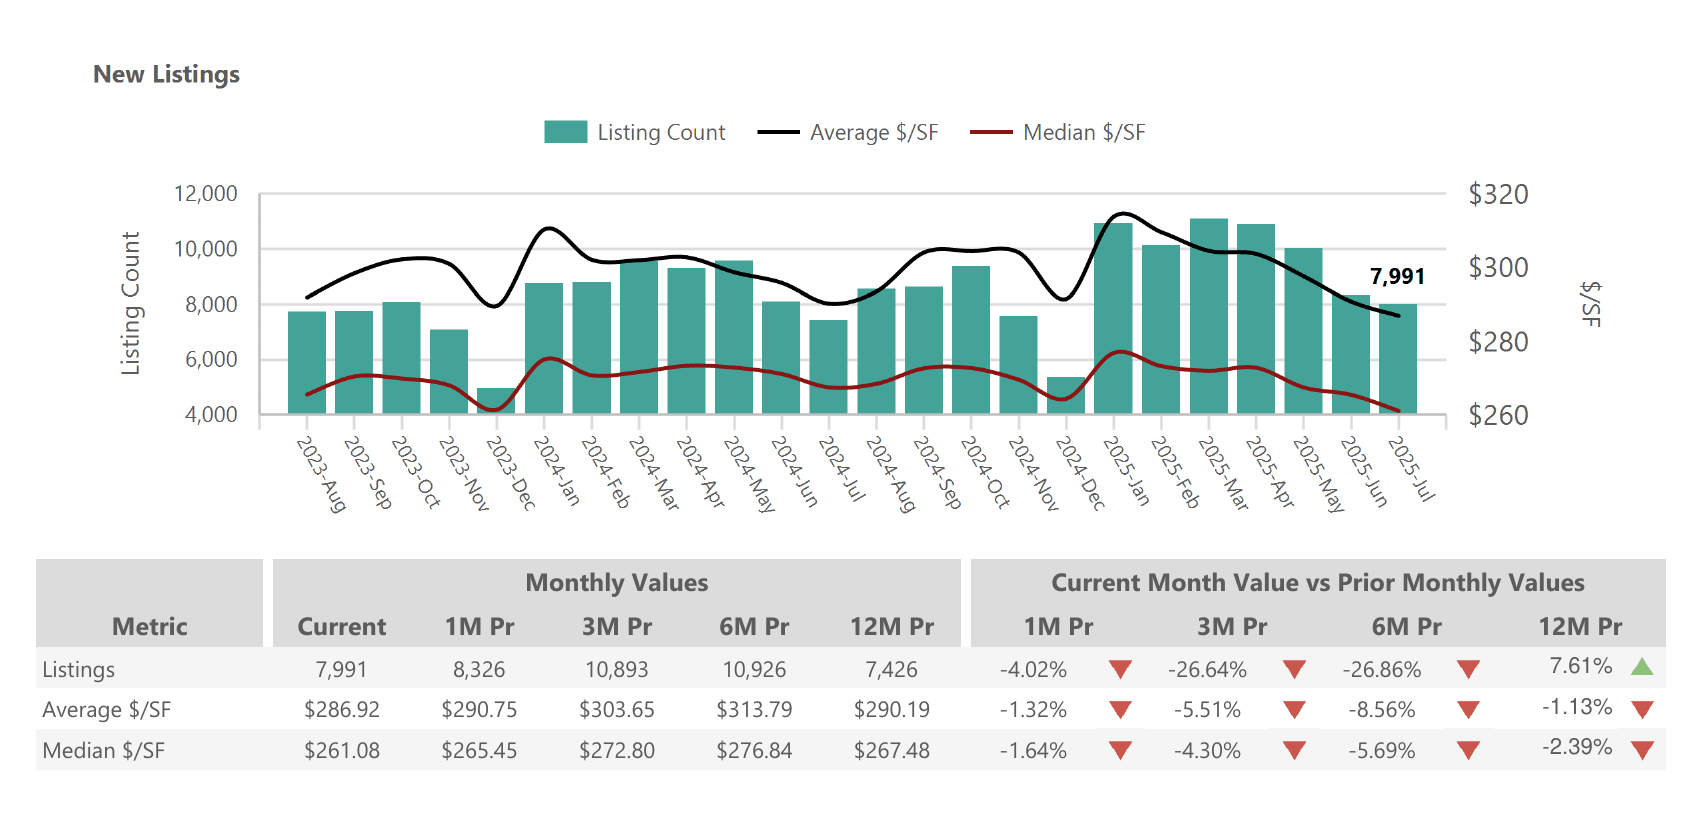
1- New listings
7,991 new homes were listed in July. This is 4.0 % fewer than June and 26.6 % below the spring surge three months ago. However, inventory remains 7.6 % higher than July 2024.
2- Average $/SF of new listings
$286.92 per square foot, down 1.3 % month‑over‑month and 8.6 % lower than six months ago as sellers adjust their expectations.
3- Median $/SF of new listings
$261.08 per square foot, down 1.6 % from June and 5.7 % below three months prior.
Pending contracts and market speed
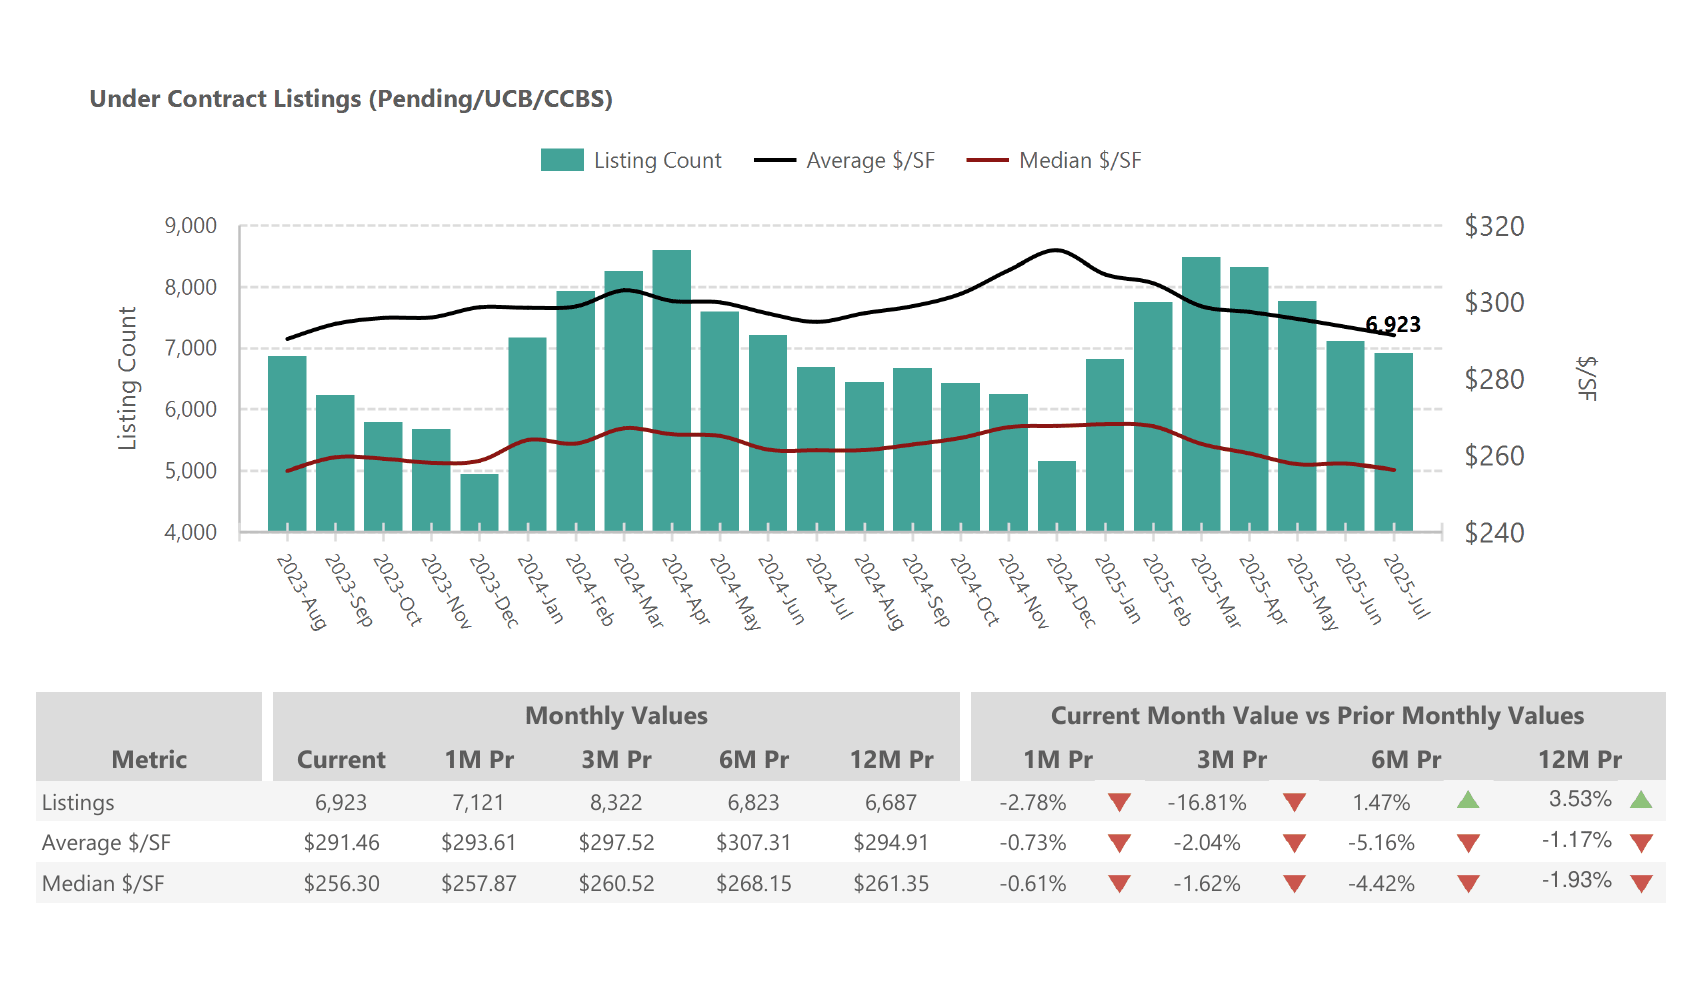
1- Under‑contract listings (Pending/UCB/CCBS)
6,923 homes were under contract at month end, down 2.8 % from June and 16.8 % below April. The average pending price per square foot was $291.46, with a median of $256.30.
2- Months of supply
Inventory equated to 3.90 months of supply in July, up slightly from June and 36.8 % higher than last year. Supply briefly dipped below 2.5 months in late 2023 before climbing back above 4 months this spring.
3- Absorption rate
Homes are selling at a 25.6 % absorption rate—slightly below June and far below the 35 % rate seen last summer. A falling absorption rate indicates more choices for buyers and longer negotiation windows.
With nearly four months of inventory, the Phoenix market is no longer fiercely seller‑dominated. Buyers can take a breath, though well‑priced homes still fetch strong offers quickly.
List prices vs. sales prices
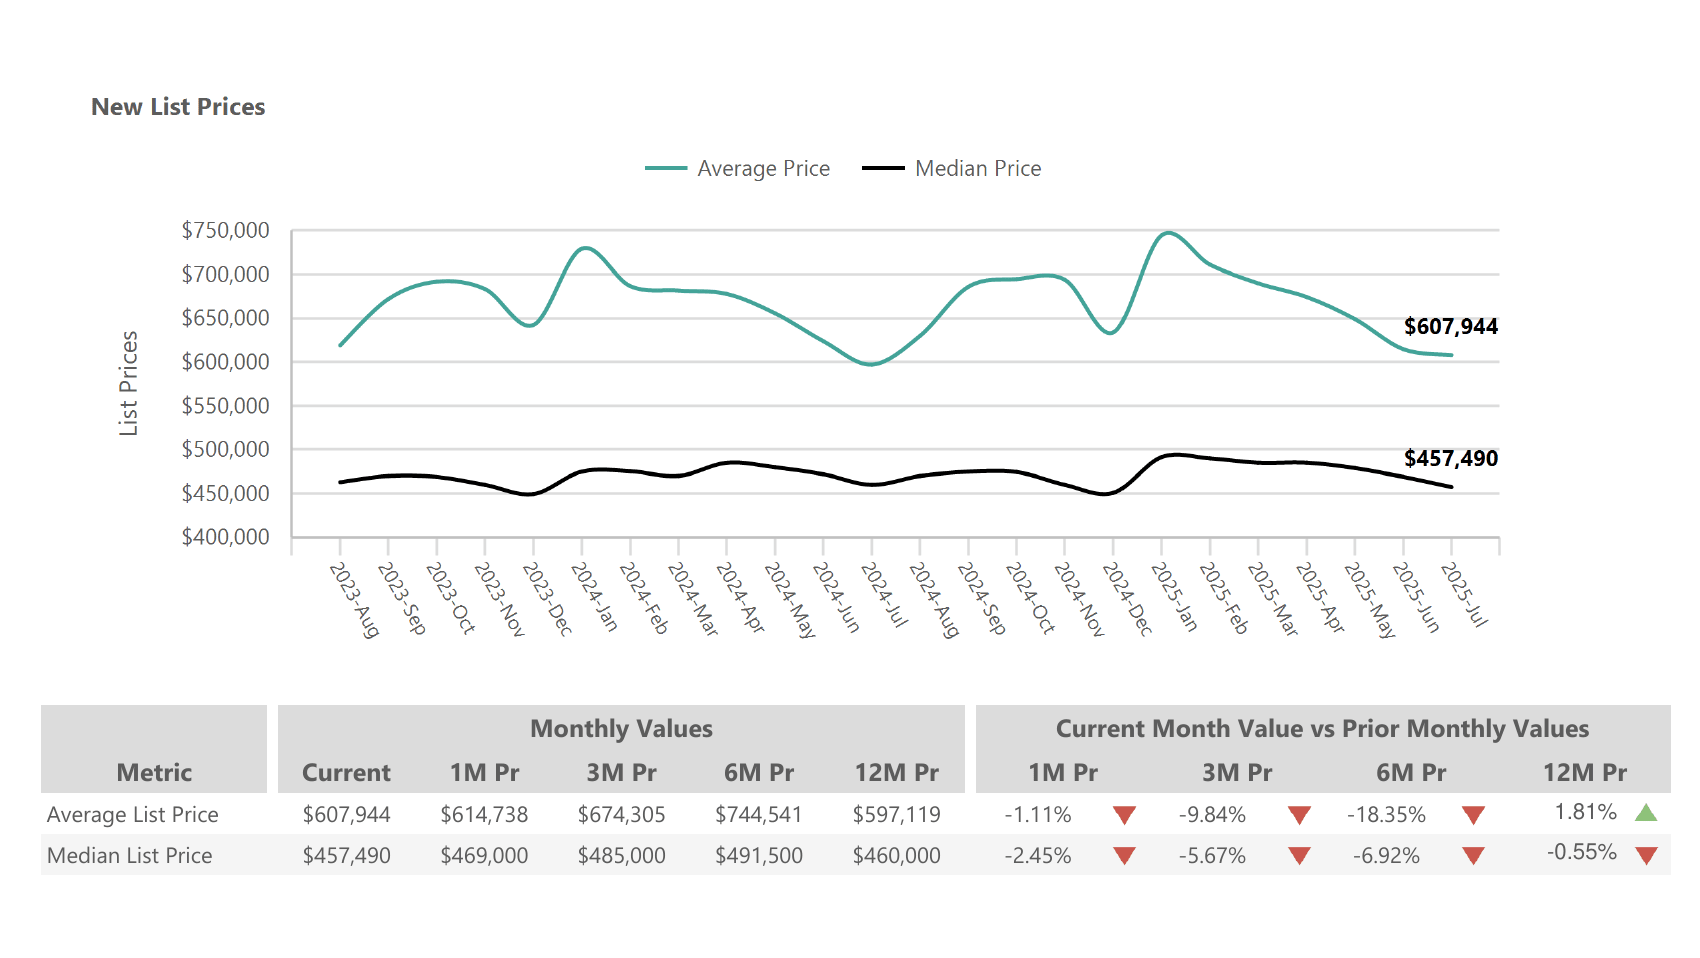
1- Average list price
At $607,944, the average list price slipped 1.1 % from June and sits 18.3 % below the lofty peak seen six months earlier. Despite the pull‑back, it’s still 1.8 % higher than July 2024, reflecting the general upward trend over the past few years.
2- Median list price
$457,490, down 2.5 % month‑over‑month and slightly below last year’s level.
3- Average sales price
Sold homes closed at $567,459 on average – 3.6 % lower than June and 7.9 % below the high set at the beginning of the year. Still, the average sale price remains 1.2 % above July 2024.
4- Median sales price
$440,000, down 1.8 % for the month and essentially unchanged compared with a year earlier.
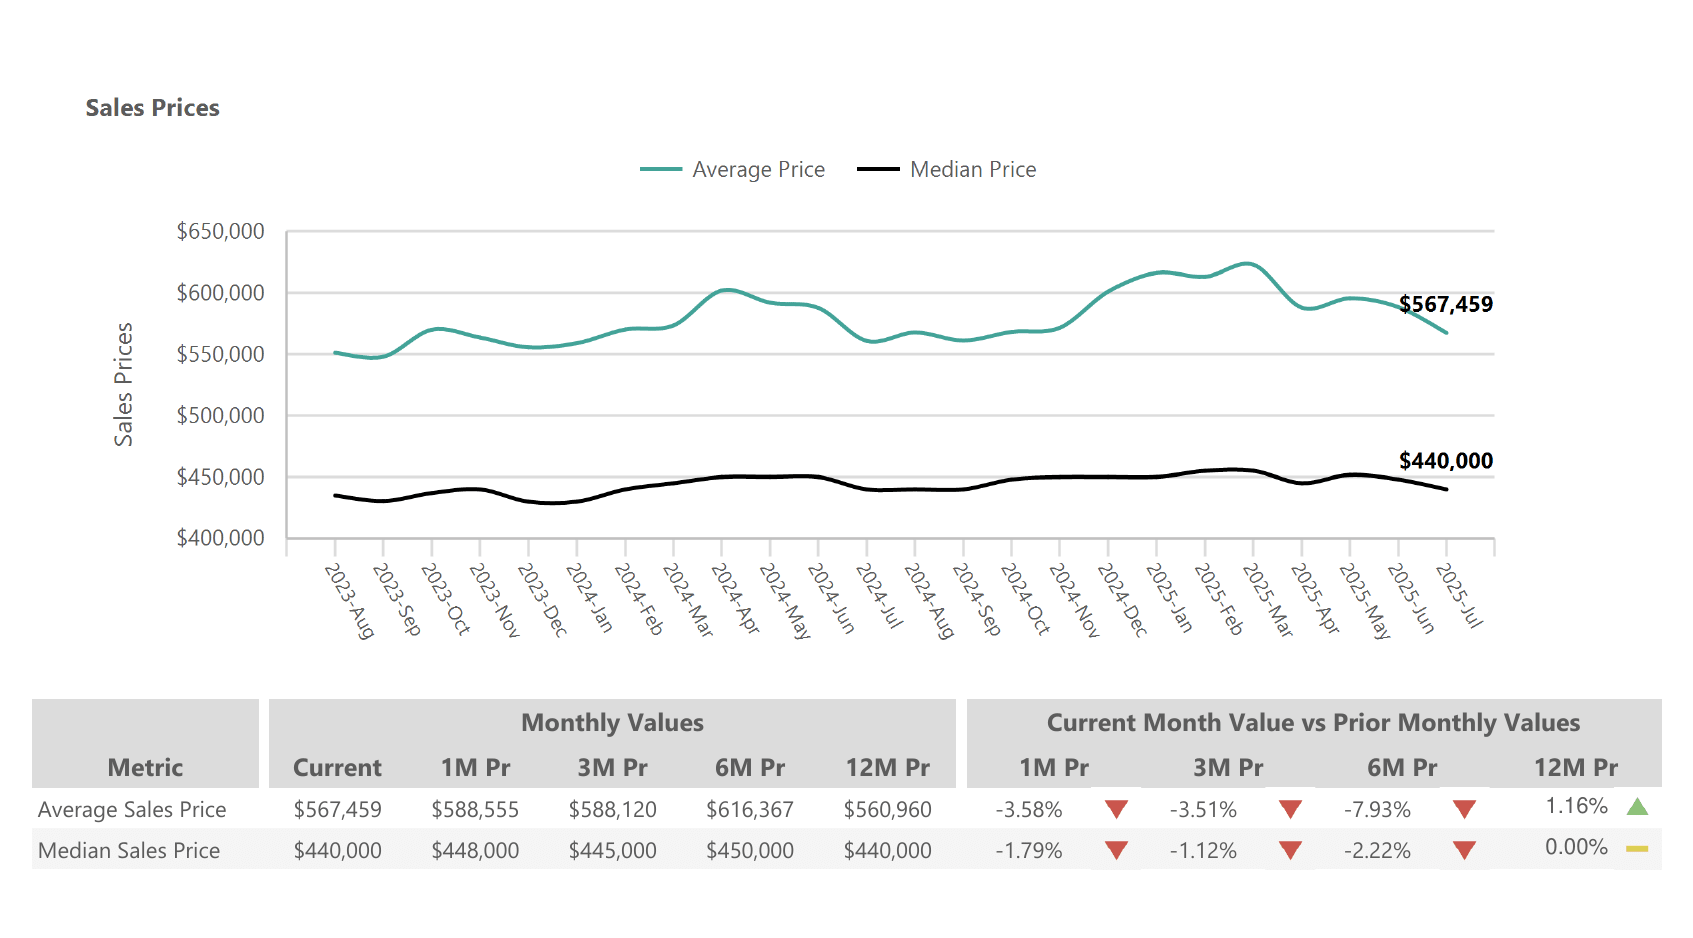
List prices typically run ahead of sales prices, and July saw that spread narrow as sellers moderated expectations. Buyers secured slightly larger discounts, but there’s no evidence of a dramatic price crash.
Days on market: how quickly homes are selling
1- Average days on market (DOM)
Homes took 83 days to sell on average in July, 5 % longer than June and 22 % longer than a year ago.
2- Median DOM
The typical home spent 63 days on market, a jump of 10.5 % month‑over‑month and 28.6 % higher than July 2024.
National and regional context
July data provide useful context for Phoenix trends:
Active listings rose 24.8% year-over-year nationwide, giving buyers more options. However, inventory growth is beginning to slow.
The national median list price was $439,450, up 0.5% year-over-year.
Homes spent a median 58 days on the market, seven days longer than last year.
Price cuts were reported on 20.6% of U.S. listings, the first decline in price reductions this year.
Inventory gains were strongest in the West (+32.5%) and South (+25.4%), with every major metro seeing year-over-year increases.
These national trends mirror Phoenix’s experience: supply is up, days on market are lengthening, and sellers are making more concessions. Yet Phoenix remains a desirable destination with an influx of buyers from higher-priced markets.
Local insights and luxury market highlights
Resident Real Estate observes that the Phoenix market is in flux: inventory is climbing and buyer leverage is growing, but demand for luxury homes in Scottsdale and Paradise Valley remains strong. Nationally, home prices grew 3.2% year-over-year and mortgage rates steadied around 6.8%. Institutional investors have pulled back (down from 8.2% to 7.5% of Phoenix purchases), giving everyday buyers more room to negotiate. Well-prepared, move-in-ready homes in premier zip codes like 85253 (Paradise Valley) and 85255 (North Scottsdale) still attract multiple bids, but dated or overpriced homes linger.
1- For Buyers: Opportunity Knocks
With 37% more inventory and homes sitting 63 days on market, buyers have regained negotiating power. Focus on homes priced right, but don't hesitate on quality properties.
Top Strategies:
- Request seller concessions (2-3% typical)
- Include inspection contingencies
- Compare multiple properties thoroughly
- Consider homes on market 60+ days
- Lock rates when favorable
2- For Sellers: Price to Compete
Success requires competitive pricing from day one. Overpriced homes are sitting longer and requiring price reductions. Professional presentation is crucial.
Winning Tactics:
- Price at or slightly below market value
- Invest in professional staging/photos
- Offer buyer incentives (rate buydowns)
- Be flexible with closing dates
- Highlight energy-efficient features
Key takeaways
Conclusion
July 2025 marks another step toward a balanced Phoenix housing market. With almost four months of supply, slower sales, and moderate price declines, the Valley is no longer the hyper-competitive arena it was during the pandemic. National trends echo this moderation: inventory is growing and time on market is lengthening. For sellers, this means pricing and presentation matter more than ever. Buyers gain breathing room but should remain prepared as turnkey homes still attract swift interest. Phoenix’s long-term fundamentals – population growth, job creation, and lifestyle appeal – remain strong, suggesting that today’s normalization sets the stage for a healthier, more sustainable market in the years ahead.