
The Greater Phoenix housing market opened 2026 with a clear signal: the balance of power is quietly shifting. January data from ARMLS confirms what the closing months of 2025 had been pointing toward — inventory is rising, demand is accelerating off a winter low, and prices are beginning to find a new equilibrium after a year of stability. The median sales price landed at $444,740, a modest 1.17% dip from December’s $450,000 reading, consistent with normal January seasonality rather than any structural weakness in the market. What the headline number doesn’t show is the more revealing story underneath: new listings surged nearly 97.5% month over month, under-contract activity jumped 36.76% from December, and average days on market climbed to 94 days — all of which paint the picture of a market recalibrating, not retreating.
This January 2026 Phoenix housing market report delivers a full analysis of every key indicator — sold listings, active inventory, supply and absorption, pricing trends, and days on market — along with practical guidance for buyers, sellers, and investors navigating the Valley’s evolving real estate landscape.
Key Takeaways:
- Median sales price: $444,740 (−1.17% month over month; −1.17% year over year)
- Average sales price: $616,010 (+1.01% month over month; essentially flat year over year at −0.05%)
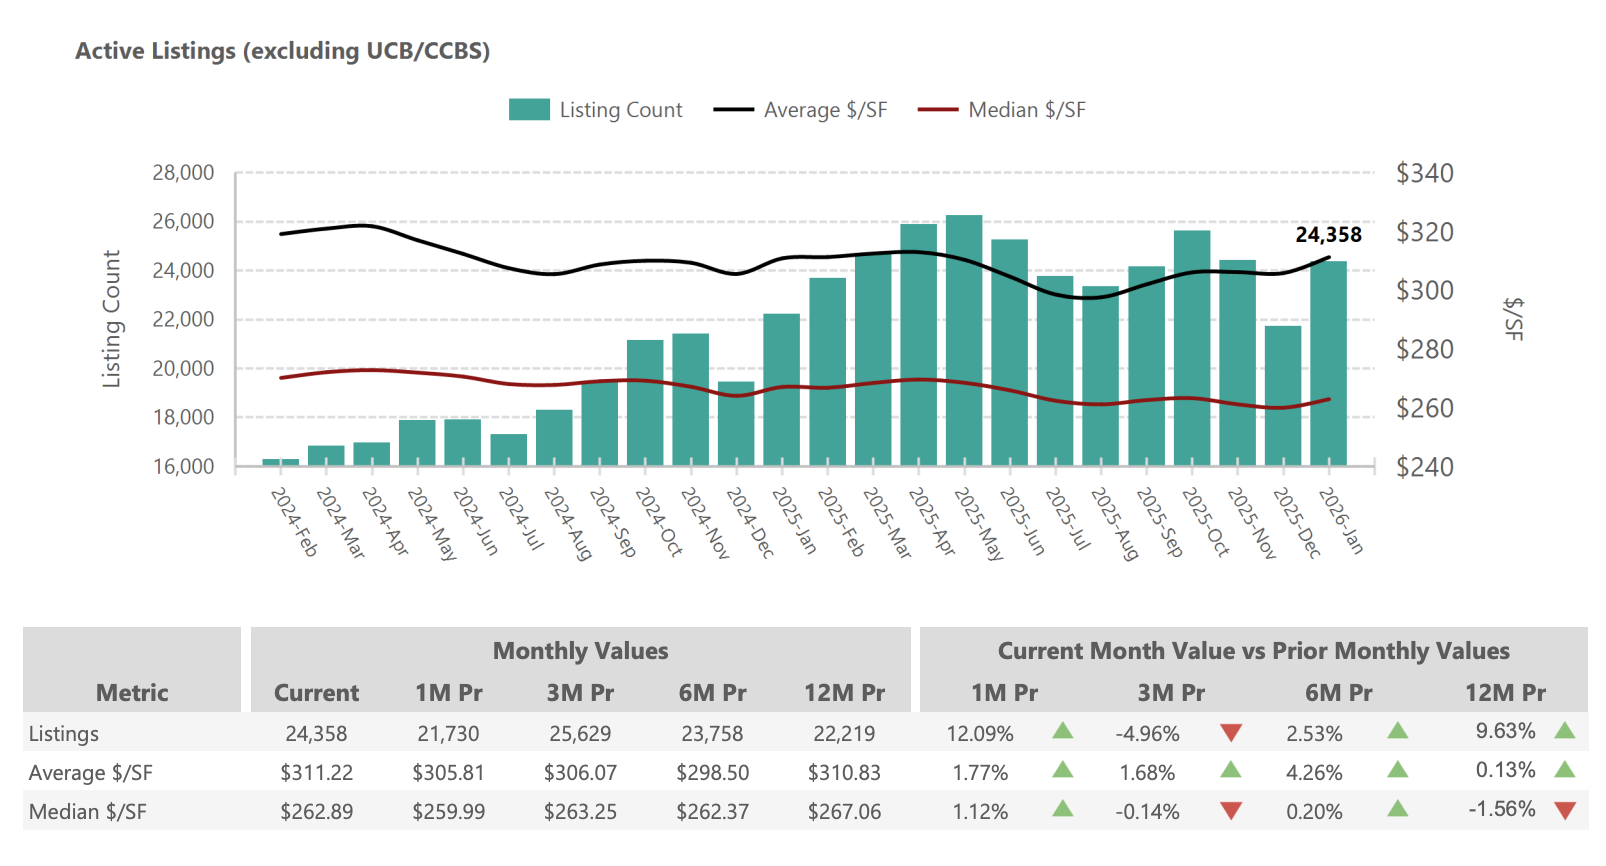
- Active listings (excl. UCB/CCBS): 24,358 (+12.09% from December; +9.63% year over year)
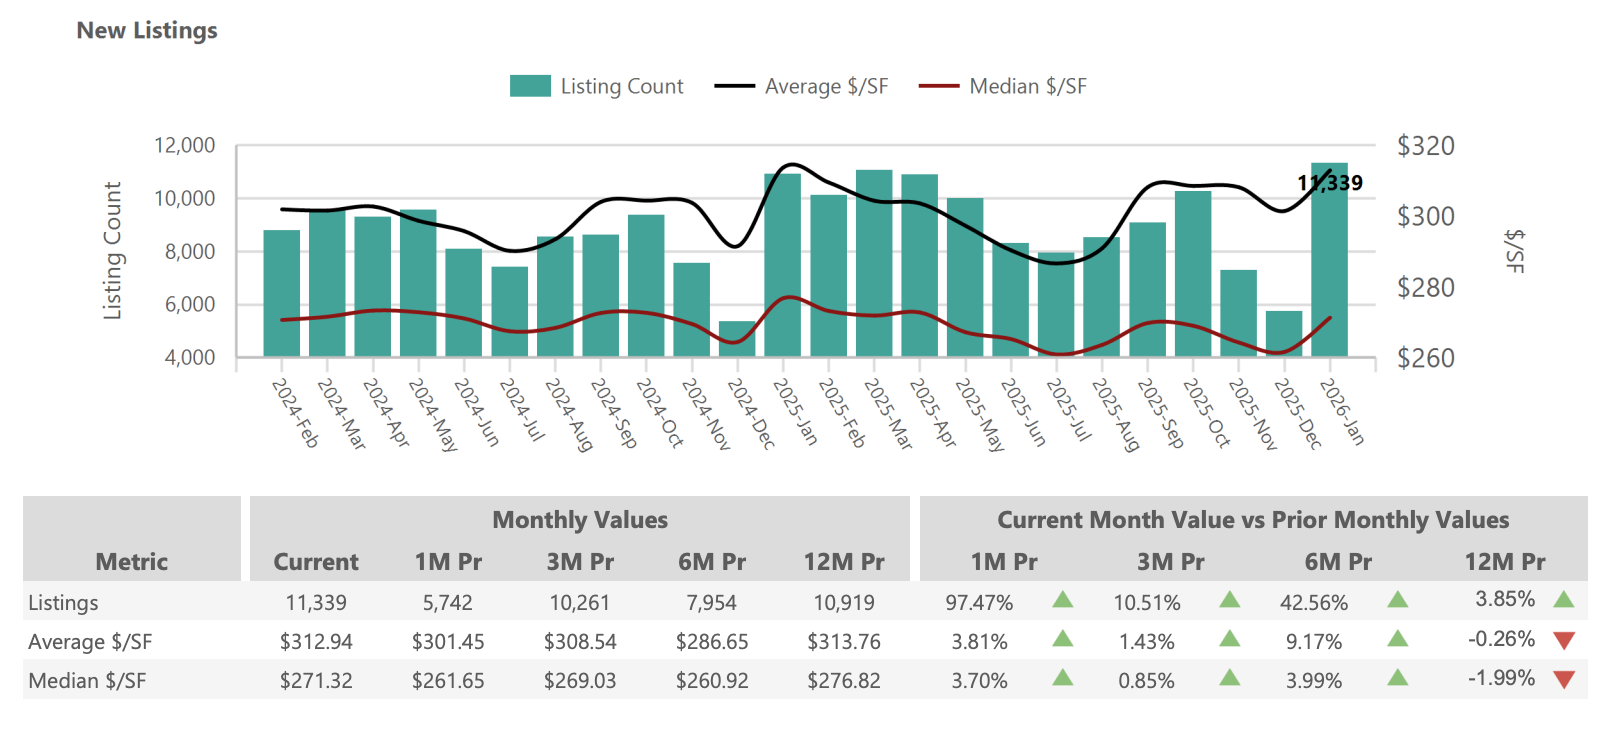
- New listings: 11,339 (+97.47% from December; +3.85% year over year)
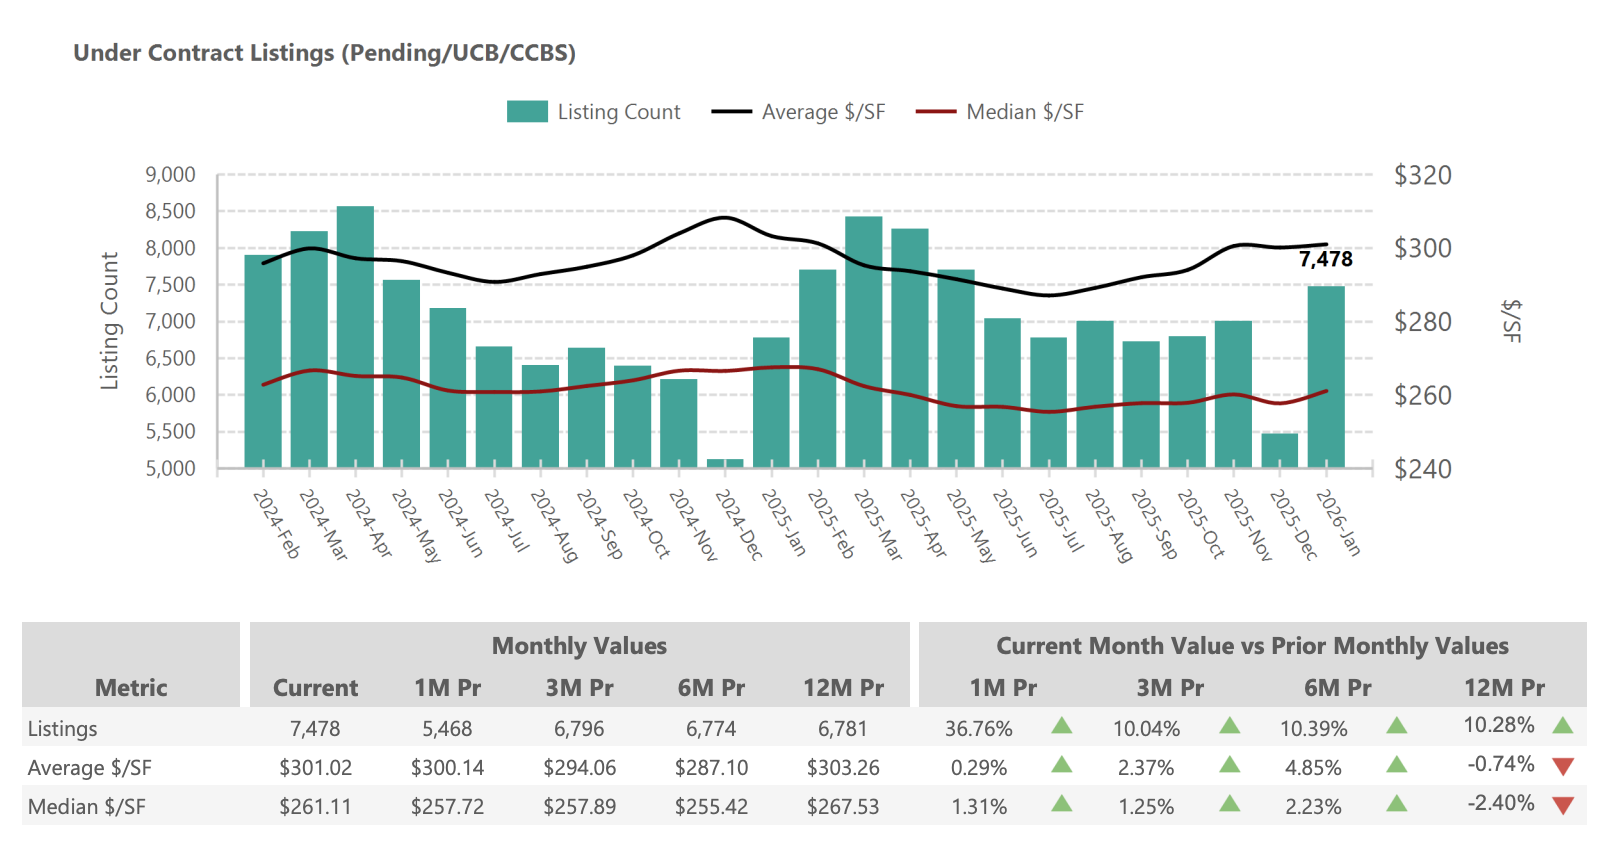
- Under contract: 7,478 (+36.76% from December; +10.28% year over year)
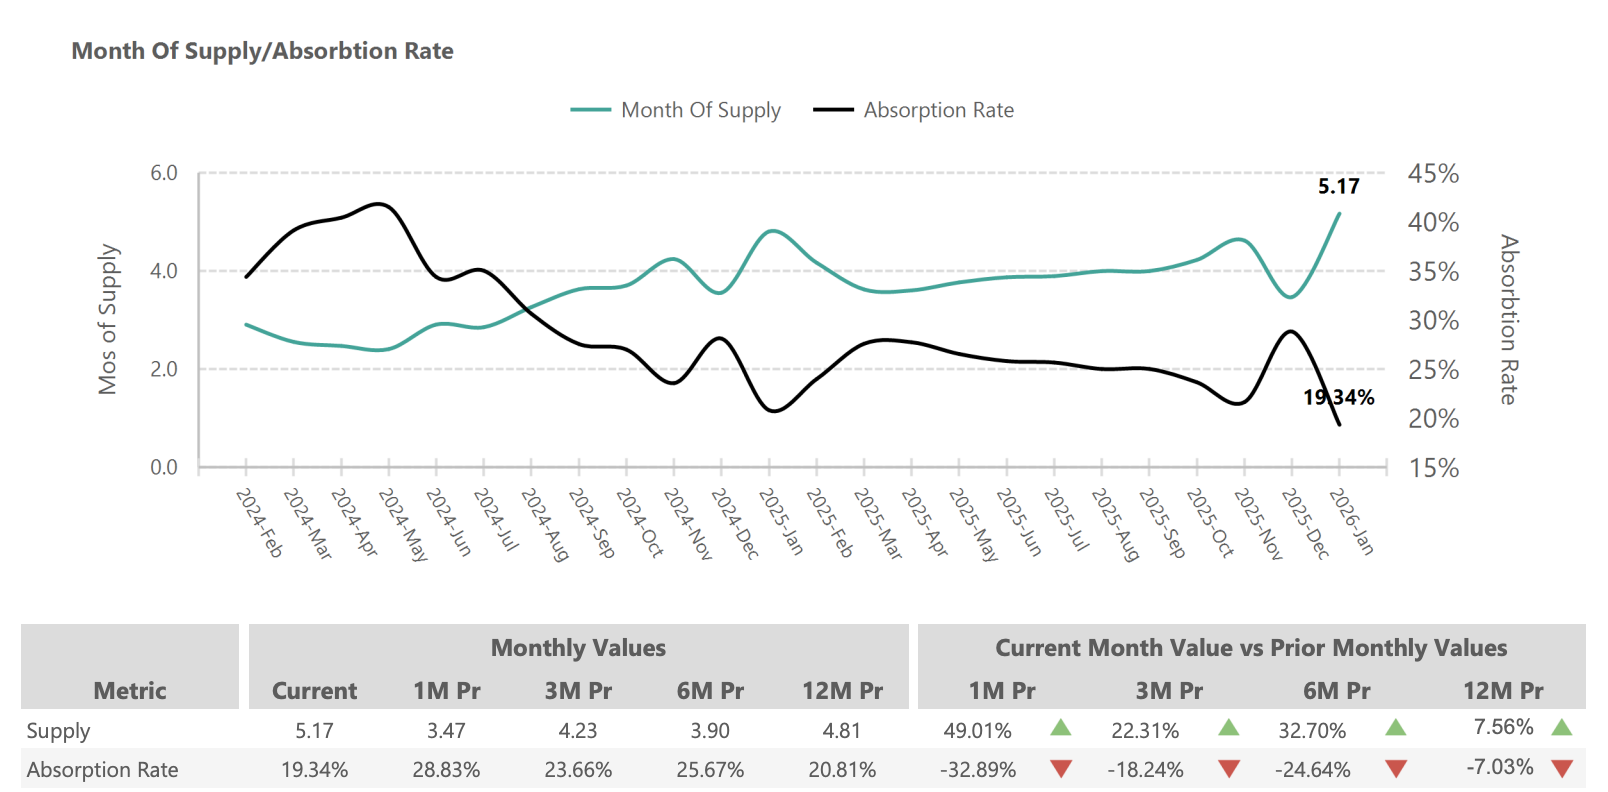
- Months of supply: 5.17 (+49.01% from December; +7.56% year over year)
- Absorption rate: 19.34% (−32.89% from December; −7.03% year over year)
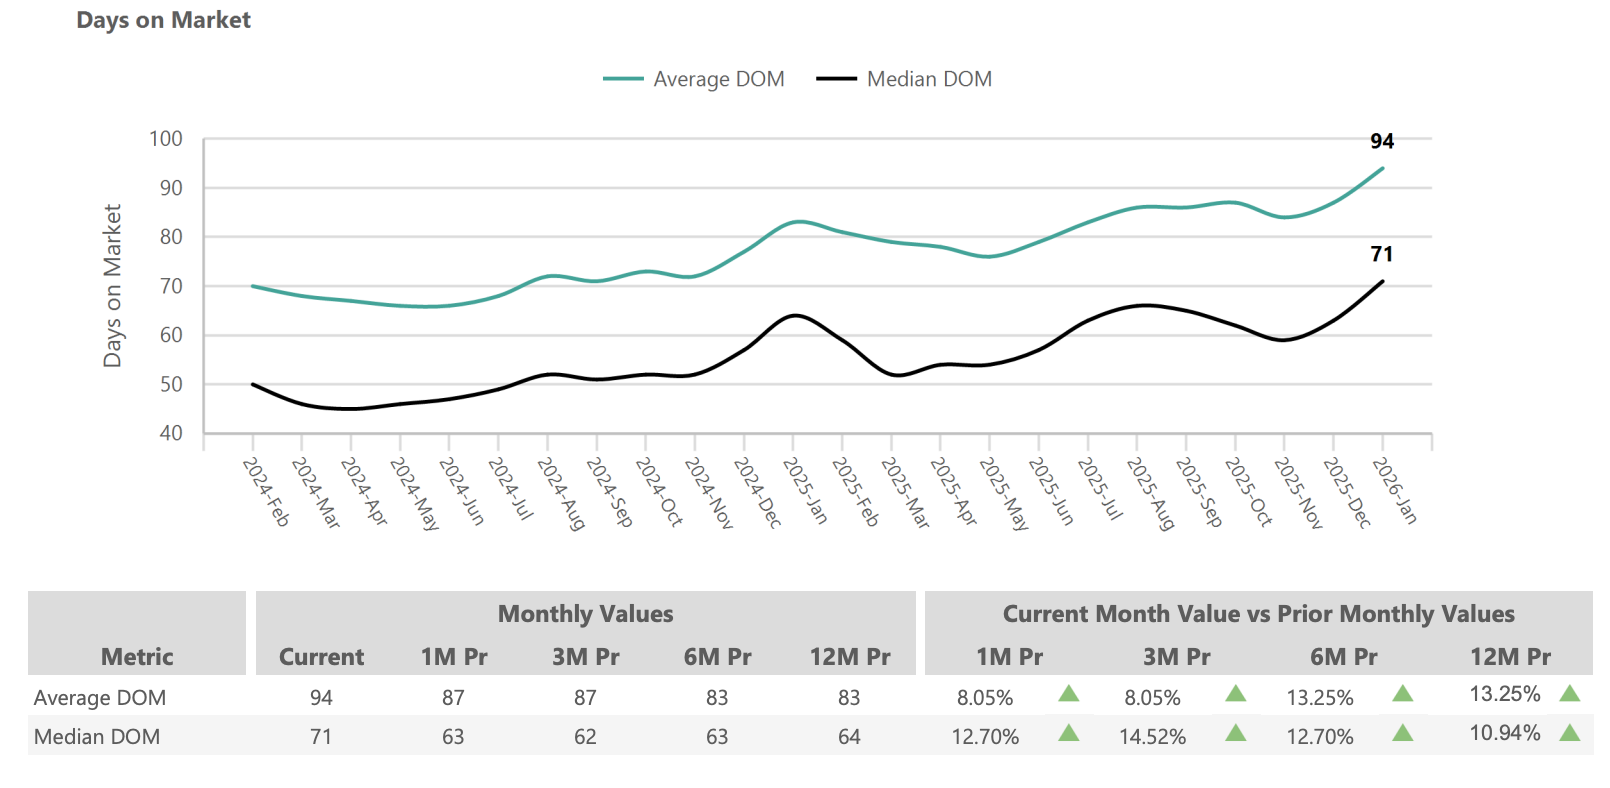
- Average days on market: 94 days (+8.05% month over month; +13.25% year over year)
- Median days on market: 71 days (+12.70% month over month; +10.94% year over year)
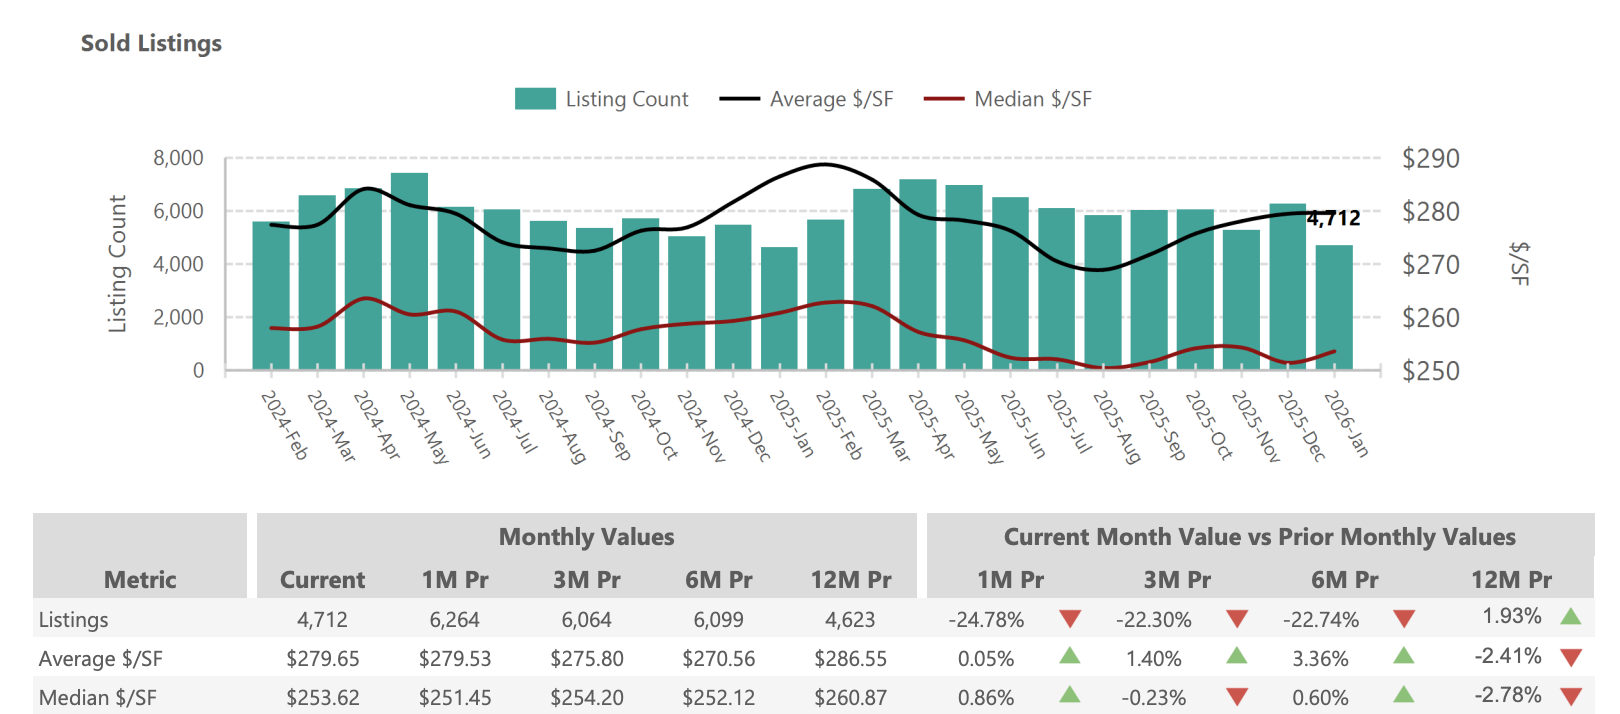
- Sold listings: 4,712 (−24.78% from December; +1.93% year over year)
Phoenix Home Prices January 2026: A Market Finding Its Floor
1- Current Pricing Trends
Phoenix home prices in January 2026 reflect a market making a predictable seasonal move rather than a directional break. The median sales price of $444,740 sits 1.17% below December’s $450,000 figure — a modest pullback that mirrors the typical January pattern when buyer activity cools over the holidays and the least competitively priced homes close escrow. What’s more instructive is the 12-month trajectory: the median has held within a remarkably tight band between $440,000 and $450,000 for the better part of a year.
January 2026 Price Metrics:
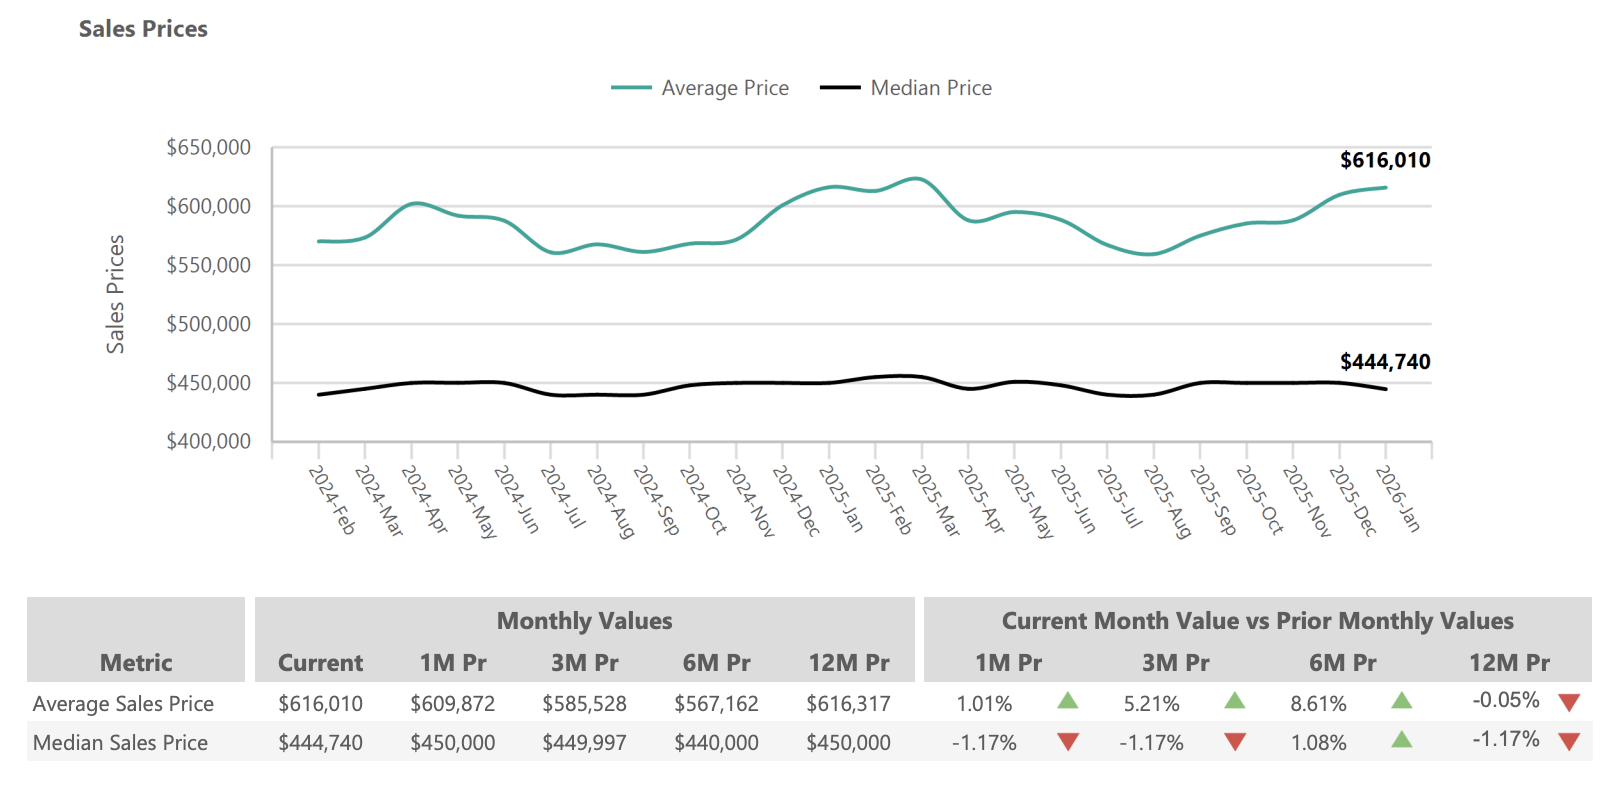
- Median sales price: $444,740 (−1.17% from 1M prior; −1.17% from 12M prior)
- Average sales price: $616,010 (+1.01% from 1M prior; −0.05% from 12M prior)
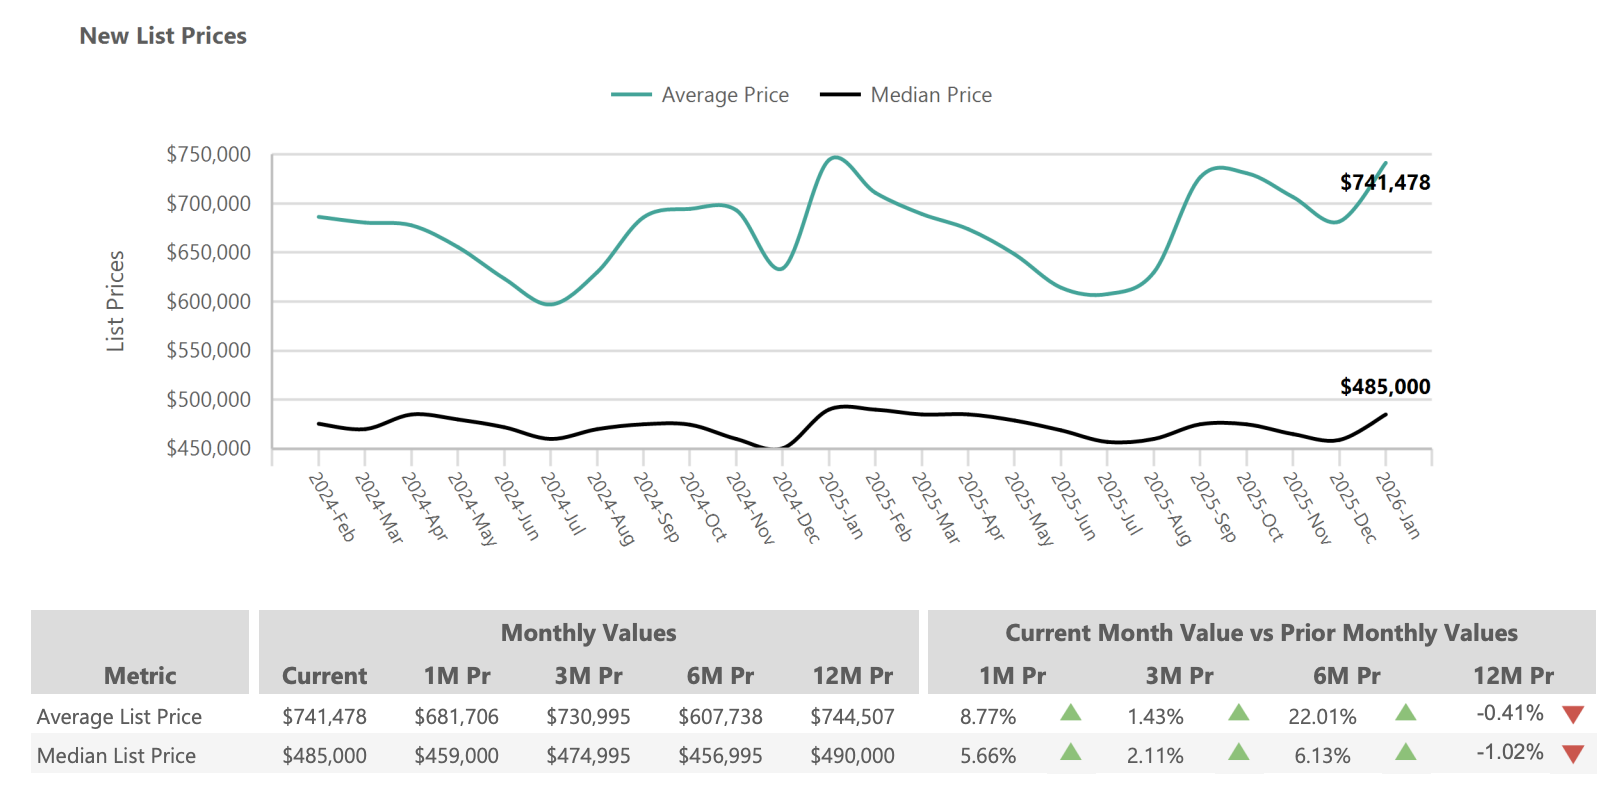
- Average list price (new listings): $741,478 (+8.77% from 1M prior; −0.41% from 12M prior)
- Median list price (new listings): $485,000 (+5.66% from 1M prior; −1.02% from 12M prior)
- Average price per square foot (sold): $279.65 (essentially flat at +0.05% from 1M prior)
- Median price per square foot (sold): $253.62 (+0.86% from 1M prior)
The spread between the average ($616,010) and median ($444,740) sales price tells an important story: the luxury segment remains active and is skewing the average upward, while the broad mid-market is holding relatively firm. Sellers at the $1M+ tier are finding buyers; those in the $400,000–$500,000 range are competing against an inventory backdrop that now gives buyers more options and more time.
2. Historical Context: The Plateau and What Comes Next
Greater Phoenix home values peaked at approximately $480,000 in May 2022, fueled by the pandemic-era migration surge and historically low mortgage rates. Since then, prices have declined modestly and stabilized — the current $444,740 median represents about a 7% correction from that all-time high. To put that in context: during the 2008–2011 housing crisis, Phoenix prices fell more than 50%. The current environment is a controlled recalibration, not a collapse.
Over the past 12 months, the median has oscillated narrowly: July 2025 at $440,000, September at $450,000, December at $450,000, and January 2026 at $444,740. That’s a range of barely $10,000 over six months — a degree of stability rarely seen in Phoenix real estate history. The market is not climbing, but it is not breaking either. The foundation underneath demand — Arizona’s job growth, semiconductor investment, and ongoing population migration — remains intact.
The more significant pricing pressure in January comes from the new listings side. The average new list price jumped 8.77% month over month to $741,478, which partially reflects the seasonal return of higher-end sellers re-entering the market after the holidays. The median new list price of $485,000 is more grounded and suggests sellers are pricing with some optimism as spring approaches. Whether buyers reward that optimism depends heavily on where mortgage rates settle in February and March.
3. Submarket Variations Across Greater Phoenix
Price performance in January 2026 was not uniform across the Valley. The broader ARMLS data reflects Greater Phoenix as a whole, but meaningful variation exists by submarket and price tier:
Scottsdale and Paradise Valley continued to demonstrate resilience at the high end, with luxury homes ($1M+) accounting for a growing share of overall closings. The average list price spike to $741,478 is partially explained by new luxury inventory entering the market in these areas.
Gilbert, Chandler, and Mesa — the core East Valley market — continued to see steady mid-range demand in the $450,000–$600,000 band, though sellers are pricing more carefully than they were in 2023 and concessions remain common.
West Valley markets including Goodyear, Surprise, and Buckeye entered 2026 with more supply relative to demand than the East Valley, giving buyers in those areas additional negotiating room and longer home search timelines.
Central Phoenix and Tempe showed continued interest in urban infill and walkable neighborhoods, with buyers prioritizing location over size.
Phoenix Housing Inventory January 2026: The New Listings Surge
1- Inventory Trends and Analysis
If there is one number that defines the January 2026 Phoenix housing market, it is the new listings figure: 11,339 new listings entered the market in January, up 97.47% from December’s 5,742. That near-doubling is almost entirely seasonal — sellers who paused during the holiday period flooded back to the market in January — but the year-over-year increase of 3.85% confirms that the trend toward more inventory is continuing into 2026.
Active listings (excluding under-contract/UCB/CCBS) stood at 24,358 at month end, up 12.09% from December and 9.63% higher than January 2025. This is a meaningful inventory expansion. To understand the scale: in early 2022, Phoenix had fewer than 4,000 active listings. Today’s 24,358 represents a fundamentally different market dynamic — one where buyers have real choices and sellers must price competitively to attract attention.
January 2026 Inventory Metrics:
- Active listings (excl. UCB/CCBS): 24,358 (+12.09% from 1M prior; +9.63% year over year)
- New listings: 11,339 (+97.47% from 1M prior; +3.85% year over year)
- Under contract (Pending/UCB/CCBS): 7,478 (+36.76% from 1M prior; +10.28% year over year)
2. The Under-Contract Signal: Demand Is Accelerating
The most encouraging data point in January’s report is not the price or the inventory — it is the under-contract count. 7,478 homes went under contract in January, up 36.76% from December’s 5,468 and 10.28% above January 2025’s 6,781. This is a meaningful acceleration in buyer commitment, particularly coming off a notoriously slow holiday period.
Under-contract activity is a leading indicator for closed sales 30–45 days out. If that pending activity converts at a normal rate, February and March closings should reflect stronger transaction volume than January’s 4,712 closed sales. Buyers who spent the holiday season watching from the sidelines appear to be stepping back in.
3. New Listings: A Seasonal Surge with a Year-Over-Year Context
The 97.47% month-over-month jump in new listings sounds alarming until you understand the seasonal pattern. December is always the slowest month for new listing activity as sellers pause during the holidays. January is always the rebound. The more meaningful number is the 3.85% year-over-year increase, which confirms that slightly more sellers are entering the market now than at this time last year — not dramatically more, but consistently more.
The year-over-year increase in new listings, combined with the year-over-year increase in active inventory, tells a coherent story: supply is gradually expanding in Greater Phoenix. This is healthy for the long-term functioning of the market, giving buyers more options and reducing the artificial scarcity that drove the frenzied price appreciation of 2021–2022.
Months of Supply and Absorption Rate: Reading the Market Temperature
1. Supply Climbs to 5.17 Months
The months of supply metric — which measures how long it would take to exhaust current inventory at the current sales pace — reached 5.17 months in January 2026. This represents a 49.01% increase from December’s 3.47 months and a 7.56% increase year over year.
The spike from December to January is almost entirely mechanical: sold listings dropped sharply (a seasonal norm), while active inventory jumped due to the new listing surge. The resulting ratio skews high in January and will normalize as spring buying activity picks up.
Real estate economists generally define market balance at 4–6 months of supply. At 5.17 months, Phoenix sits squarely within the balanced zone — neither a seller’s market (below 4 months) nor a buyer’s market (above 6 months). This is a notable contrast to the near-zero supply conditions of 2021–2022, and even to the 3.47-month reading from December 2025.
2. Absorption Rate: Seasonal Softening With Context
The absorption rate — the percentage of active listings that went under contract in a given month — fell to 19.34% in January, down 32.89% from December’s 28.83%. Again, this decline is characteristic of January everywhere: fewer buyers close on homes in a month bookended by New Year’s and the Super Bowl.
The year-over-year comparison is more telling: the 19.34% absorption rate is 7.03% below January 2025’s 20.81%. That gap suggests buyer absorption velocity has declined modestly compared to this time last year, which is consistent with the slightly elevated inventory and the continued impact of mortgage rates in the mid-to-upper 6% range on buyer purchasing power.
When mortgage rates tick lower — as market participants widely expect through 2026 — the absorption rate will respond. A 50-basis-point decline in the 30-year fixed rate adds meaningful purchasing power for buyers in the $400,000–$550,000 range, and the pent-up demand is real.
New List Prices: Sellers Pricing with Spring Optimism
The average new list price in January 2026 came in at $741,478, a striking 8.77% jump from December’s $681,706. The median new list price of $485,000 tells a more moderate story, up 5.66% from December and 6.13% from six months prior.
The divergence between average and median new list prices points to the return of high-end inventory. Luxury sellers — those listing at $1M and above — sit out the holidays more often than other market segments, and their January re-entry inflates the average. For the typical home in the $400,000–$600,000 range, the median list price of $485,000 provides a more accurate benchmark.
On a year-over-year basis, both the average (−0.41%) and median (−1.02%) new list prices are essentially flat, confirming that sellers have recalibrated their expectations from the peak years and are pricing realistically for today’s market conditions.
The gap between the median new list price ($485,000) and the median sales price ($444,740) — a spread of approximately $40,000 — reflects the negotiating room buyers currently have. Homes are not selling at full asking price; they are selling with meaningful discounts or concessions. Sellers who price at the market rather than above it are finding buyers; those who price for the market of 2022 are sitting.
Sales Prices: The Complete Picture
The full sales price data for January 2026 confirms that buyers are finding value in a market where sellers have accepted more realistic expectations. The average sales price of $616,010 rose 1.01% from December and is essentially flat year over year (−0.05%), while the median sales price of $444,740 declined slightly from both the prior month and prior year.
The average price per square foot for sold homes — $279.65 — is marginally above December’s $279.53, and up 3.36% from six months ago. On a 12-month basis, however, it is down 2.41%, reflecting the gradual normalization from the price-per-square-foot peaks of 2022.
The median price per square foot of $253.62 is up 0.86% from December and 0.60% above six months ago, though down 2.78% year over year. This metric is particularly useful for comparing apples to apples across different home sizes: at roughly $254 per square foot at the median, Phoenix remains competitive with comparable Sun Belt metros, particularly given the Valley’s income growth and infrastructure investment in recent years.
Days on Market: Buyers Have More Time, Sellers Need More Patience
1. Current Selling Timeframes
The days on market (DOM) data for January 2026 confirms what inventory and absorption data suggested: buyers are taking more time to decide, and sellers need to plan accordingly. The average DOM climbed to 94 days, up 8.05% from December’s 87 and 13.25% above January 2025’s 83. The median DOM reached 71 days, up 12.70% from December’s 63 and 10.94% above January 2025’s 64.
These numbers require context. In the frenzied market of early 2022, the median DOM in Phoenix was as low as 7 days. Homes routinely sold in hours with multiple competing offers above asking price. The current 71-day median is not a crash — it is a return to a market where buyers can do their due diligence, attend inspections, and negotiate without the fear-of-missing-out pressure that defined the pandemic era.
January 2026 Days on Market:
- Average DOM: 94 days (+8.05% from 1M prior; +13.25% from 12M prior)
- Median DOM: 71 days (+12.70% from 1M prior; +10.94% from 12M prior)
2. What Sells Quickly vs. What Sits
In today’s Phoenix market, time on market is not random — it is a direct function of pricing accuracy and property condition. Homes that are priced within 2–3% of true market value and presented in move-in ready condition are still moving within 30–45 days. Homes that arrive overpriced, need significant work, or are located in less-desirable pockets of the Valley are accumulating the extended DOM readings that are pulling the average to 94 days.
The extended average DOM (94 days) vs. the median DOM (71 days) gap reveals that a segment of the market — likely overpriced listings or challenged properties — is sitting significantly longer and pulling the average up. The median is the better indicator of what a well-positioned, competitively priced home can expect.
For sellers, the message is direct: accurate pricing is the most powerful tool available. Homes that need price reductions after going to market almost always end up selling for less than they would have at a well-considered initial list price.
Economic Drivers: Why Phoenix Real Estate Stays Resilient
Job Growth and the Semiconductor Transformation
Greater Phoenix’s economy entered 2026 from a position of genuine strength. Arizona’s job growth continues to run at 2.1%–2.5% annually — nearly double the national average — driven by a diversified base that spans healthcare, technology, financial services, and the now-defining semiconductor industry.
The TSMC investment story alone is transformative. The Taiwan Semiconductor Manufacturing Company’s Fab 21 campus in north Phoenix is operational, and the company has announced expansions that bring its total Arizona investment to over $100 billion — including three additional fabrication facilities, advanced packaging operations, and a research and development center. Intel maintains its largest manufacturing presence anywhere in the world in the Phoenix metro. Amkor Technology is building a $2 billion packaging facility in Peoria. These are not announcements — they are construction sites and hiring pipelines.
The downstream effect on housing is real. Semiconductor engineers, supply-chain professionals, and the service industries that support them need housing. Communities near the TSMC campus in north Phoenix and along the Loop 303 corridor are seeing particularly focused buyer interest from tech workers whose incomes exceed the Valley median by a meaningful margin.
Population Growth and the Migration Tailwind
Greater Phoenix continues to attract residents from high-cost coastal metros at a rate that sustains long-term housing demand. Net migration into the metro runs at approximately 63,000 annually, with the majority of inbound migrants arriving from California, Illinois, and Washington. For many of these buyers, a $444,740 median price in Phoenix compares favorably to what they left behind.
The Housing Affordability Index — which measures the percentage of households that can afford the median-priced home — has improved from 70 to 77 in recent months. That 7-point increase reflects the combination of stable home prices and modestly lower mortgage rates from the highs of late 2023. More Phoenix households can afford a home today than at any point in the past four years.
Mortgage Rate Environment
Mortgage rates ended January 2026 in the mid-to-upper 6% range for a 30-year fixed loan, after the Federal Reserve held rates steady at its late-January meeting. While these rates remain higher than the 2020–2021 lows that inflated the market, they represent meaningful improvement from the 7.19% peak of early 2024. Each 25-basis-point decline in rates adds thousands of buyers back to the qualified pool — and the direction of rates, while uncertain in timing, is broadly expected to be downward through 2026.
New construction builders in Phoenix have been particularly aggressive with rate buydowns, offering permanent rate reductions into the 4%–5% range. This creates a meaningful incentive for buyers who are flexible on location to consider new builds, and it puts competitive pressure on resale sellers, particularly in the under-$500,000 segment.
Is the Phoenix Housing Market Going to Crash?
This is the question that drives more real estate searches than any other in early 2026, and it deserves a direct answer: no, and the data does not support that conclusion.
The 2008 housing crisis was a credit crisis. It was built on subprime mortgages, no-documentation loans, and speculative flipping at a scale that created systemic financial fragility. The current Phoenix market has none of those characteristics. The vast majority of existing homeowners refinanced at rates between 2.5% and 4.5% during 2020–2022. They have no financial incentive to sell — and no financial distress forcing them to. Foreclosure activity remains at historical lows.
What the current market does have is a correction from unsustainably high peak pricing, elevated (but declining) mortgage rates that have reduced buyer purchasing power, and a healthy expansion of inventory that gives buyers more options than they had two years ago. These are the characteristics of a normalizing market, not a collapsing one.
The Cromford Report’s market index for Greater Phoenix has been rising since December — a signal that supply-demand balance is tightening, not loosening. Mortgage purchase applications were up significantly year over year entering 2026. The spring buying season approaching is likely to be more active than spring 2025, particularly if rates tick lower.
What This Means for Buyers, Sellers, and Investors
For Home Buyers
January 2026 represents one of the better entry points for Phoenix home buyers in recent years. Inventory is near multi-year highs, giving you real selection. Days on market are extended, giving you time to think without the panic of losing out. And the negotiating environment means you can ask for seller concessions, price reductions, and inspection contingencies that simply were not available in 2021–2022.
Opportunities in the Current Market:
- More than 24,000 active listings give you genuine choice
- Extended DOM means sellers are often willing to negotiate — both on price and on concessions
- Builder rate buydowns to the 4%–5% range in new construction communities make the payment math more favorable for buyers who are flexible on location
- The $444,740 median price is still roughly 7% below the May 2022 all-time high — you are not buying at the peak
Strategic Recommendations for Buyers:
The risk of waiting for significantly lower prices or significantly lower rates is real. If rates drop from 6.5% to 5.5%, demand will spike and prices will follow. The buyers who benefit most from lower rates are often not the ones who waited — they are the ones who were already in the market and refinanced. Buy the home that fits your life and your budget now, at a price that reflects today’s market, and refinance when rates improve.
Work with a buyer’s agent who knows specific neighborhoods, not just zip codes. In a market with 24,000 active listings, the ability to identify undervalued properties versus overpriced ones is what separates buyers who get exceptional value from those who simply pay market price.
For Home Sellers
The January 2026 Phoenix market is not forgiving of wishful pricing. With 24,358 competing active listings and buyers taking 71 days on average to make a decision, sellers who price above the market will sit, accumulate days on market, and ultimately sell for less than an accurate initial list price would have yielded.
Current Market Realities:
- Buyers are comparing your home against 24,000+ others. If yours is not competitively positioned, they will not come back.
- Extended DOM is associated in buyers’ minds with something being wrong. A price reduction after 60+ days signals desperation and invites lowball offers.
- Concessions are increasingly expected. Budget for 1%–3% in seller concessions as part of your net proceeds calculation.
Success Strategies for Sellers:
Price your home at or within 1% of a realistic market value assessment from the first day on the market. Presentation matters more in a buyer-choice environment than it does in a supply-constrained one — invest in pre-listing preparation. And if you own a home with a rate below 4.5%, have an honest conversation with your agent about whether selling now serves your financial goals, or whether holding and renting is the better strategy given where replacement mortgage rates sit.
The sellers finding success in January 2026 are those who understand that the market is the market. Pricing discipline and presentation quality are the variables within a seller’s control; everything else is external.
For Investors
Greater Phoenix remains one of the more compelling long-term real estate investment markets in the country, though the easy-money environment of 2020–2021 is gone. Investors entering in 2026 need to underwrite carefully and hold realistic expectations.
Market Opportunities:
- The $444,740 median purchase price combined with average Phoenix rents in the $1,500–$1,700 range produces cap rates that pencil for buy-and-hold investors, particularly in areas with strong employment demand
- The tech and semiconductor worker migration is creating specific demand pockets — north Phoenix, Peoria, and corridors near major employer campuses — where rent growth may outpace the broader metro over the next 3–5 years
- Value-add opportunities exist in the condo and townhome segment, which has underperformed single-family and where motivated sellers exist at below-replacement-cost pricing in some cases
- New construction in the sub-$425,000 range, particularly in master-planned communities with builder incentives, offers a compelling alternative to resale for investors who can accept the 6–12 month delivery timeline
Risk Management:
The primary risk for Phoenix investors in 2026 is paying too much for a property that does not cash-flow at current rental rates. The rental market has softened slightly from its 2022–2023 peak; rent growth is modest rather than dramatic. Underwriting must reflect actual current rent levels, not peak rent assumptions. Short-term rental (STR/Airbnb) regulations vary by city and continue to evolve — Scottsdale, Tempe, and Phoenix proper have different STR environments, and investors should review current regulatory conditions before committing.
The long-term thesis for Phoenix real estate remains intact: population growth, economic diversification, and a relative affordability advantage over coastal metros. Investors who buy at reasonable prices with sound financing and hold for 5–10 years have historically been rewarded in this market.
Conclusion: What to Expect as Spring 2026 Approaches
The January 2026 Phoenix housing market tells a coherent story that diverges sharply from both the crisis narratives and the irrational optimism that often dominate real estate coverage. This is a market in the process of finding its natural level after years of artificial extremes in both directions.
Key Market Themes Heading into Spring 2026:
- Inventory is elevated but stabilizing. 24,358 active listings gives buyers choice without overwhelming the market. The new listing surge of January will need to be absorbed by spring buyers.
- Demand is re-accelerating. The 36.76% jump in under-contract listings from December to January, and the 10.28% year-over-year increase, signals that buyers who sat out the holidays are coming back.
- Prices are stable to modestly soft. The median is within a $10,000 range it has held for a year. Dramatic price drops are not supported by the data; neither are dramatic price increases in the near term.
- Rates matter enormously. The difference between 6.5% and 6.0% on a $444,740 purchase is approximately $150/month. Any meaningful rate decline will bring buyers off the sidelines quickly.
- The 5.17-month supply number is seasonal, not structural. By March, when spring buying typically kicks in, expect months of supply to compress back toward the 3.5–4.5 month range.
For buyers, the message is that you have leverage today that you will not have if you wait for the spring rush. For sellers, the message is that accurate pricing and exceptional presentation are non-negotiable in a market with this much competition. For investors, the message is to underwrite conservatively, target demand-driven locations, and hold for the long cycle.
Greater Phoenix enters 2026 with real economic momentum, a normalizing housing market, and the kind of measured conditions that reward preparation and patience over speculation and panic. The fundamentals that have made this metro one of the country’s most watched real estate markets for two decades remain firmly in place.