
The Phoenix housing market in August 2025 shows clear signs of stabilization after years of extreme seller dominance. Home prices held steady year-over-year while inventory expanded dramatically, creating the most balanced market conditions Phoenix has seen since 2019. This transformation represents a fundamental shift from the frenzied buying environment that characterized the pandemic era. The current market dynamics reflect broader economic adjustments, including higher interest rates and normalized migration patterns from other states.
Key Takeaways:
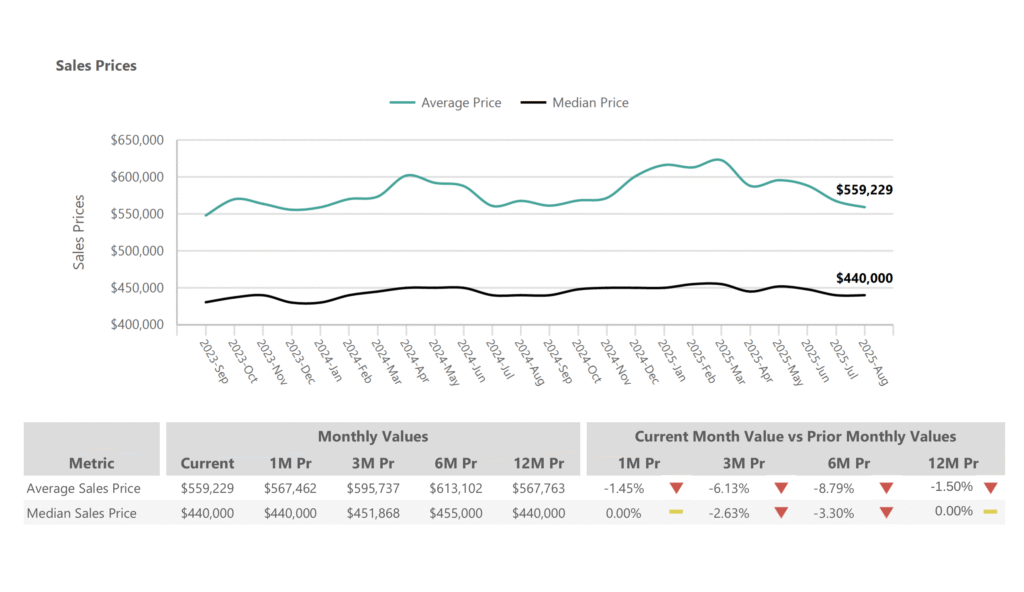
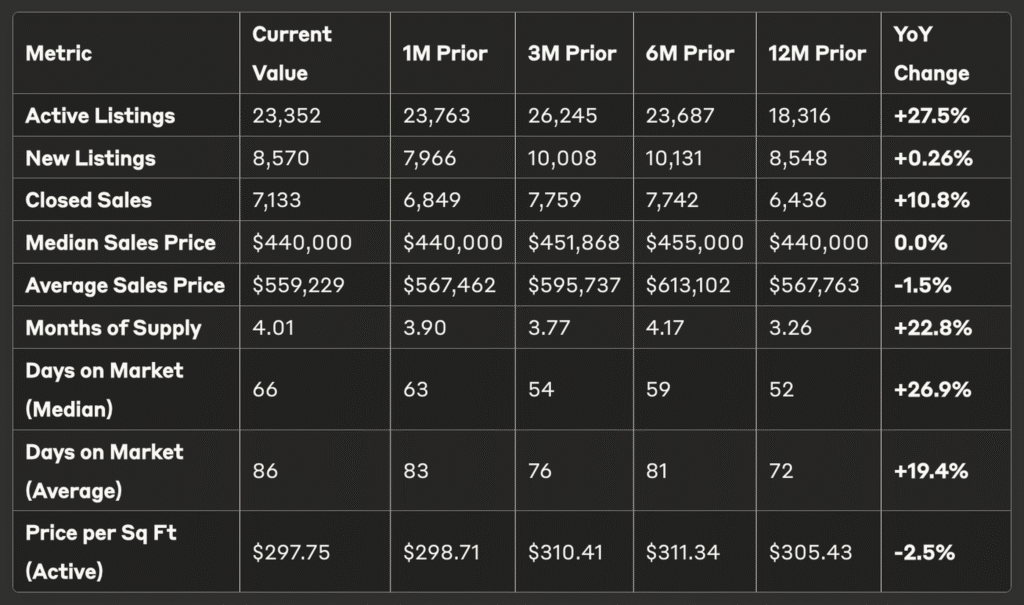
- Median home price: $440,000 (unchanged from August 2024)
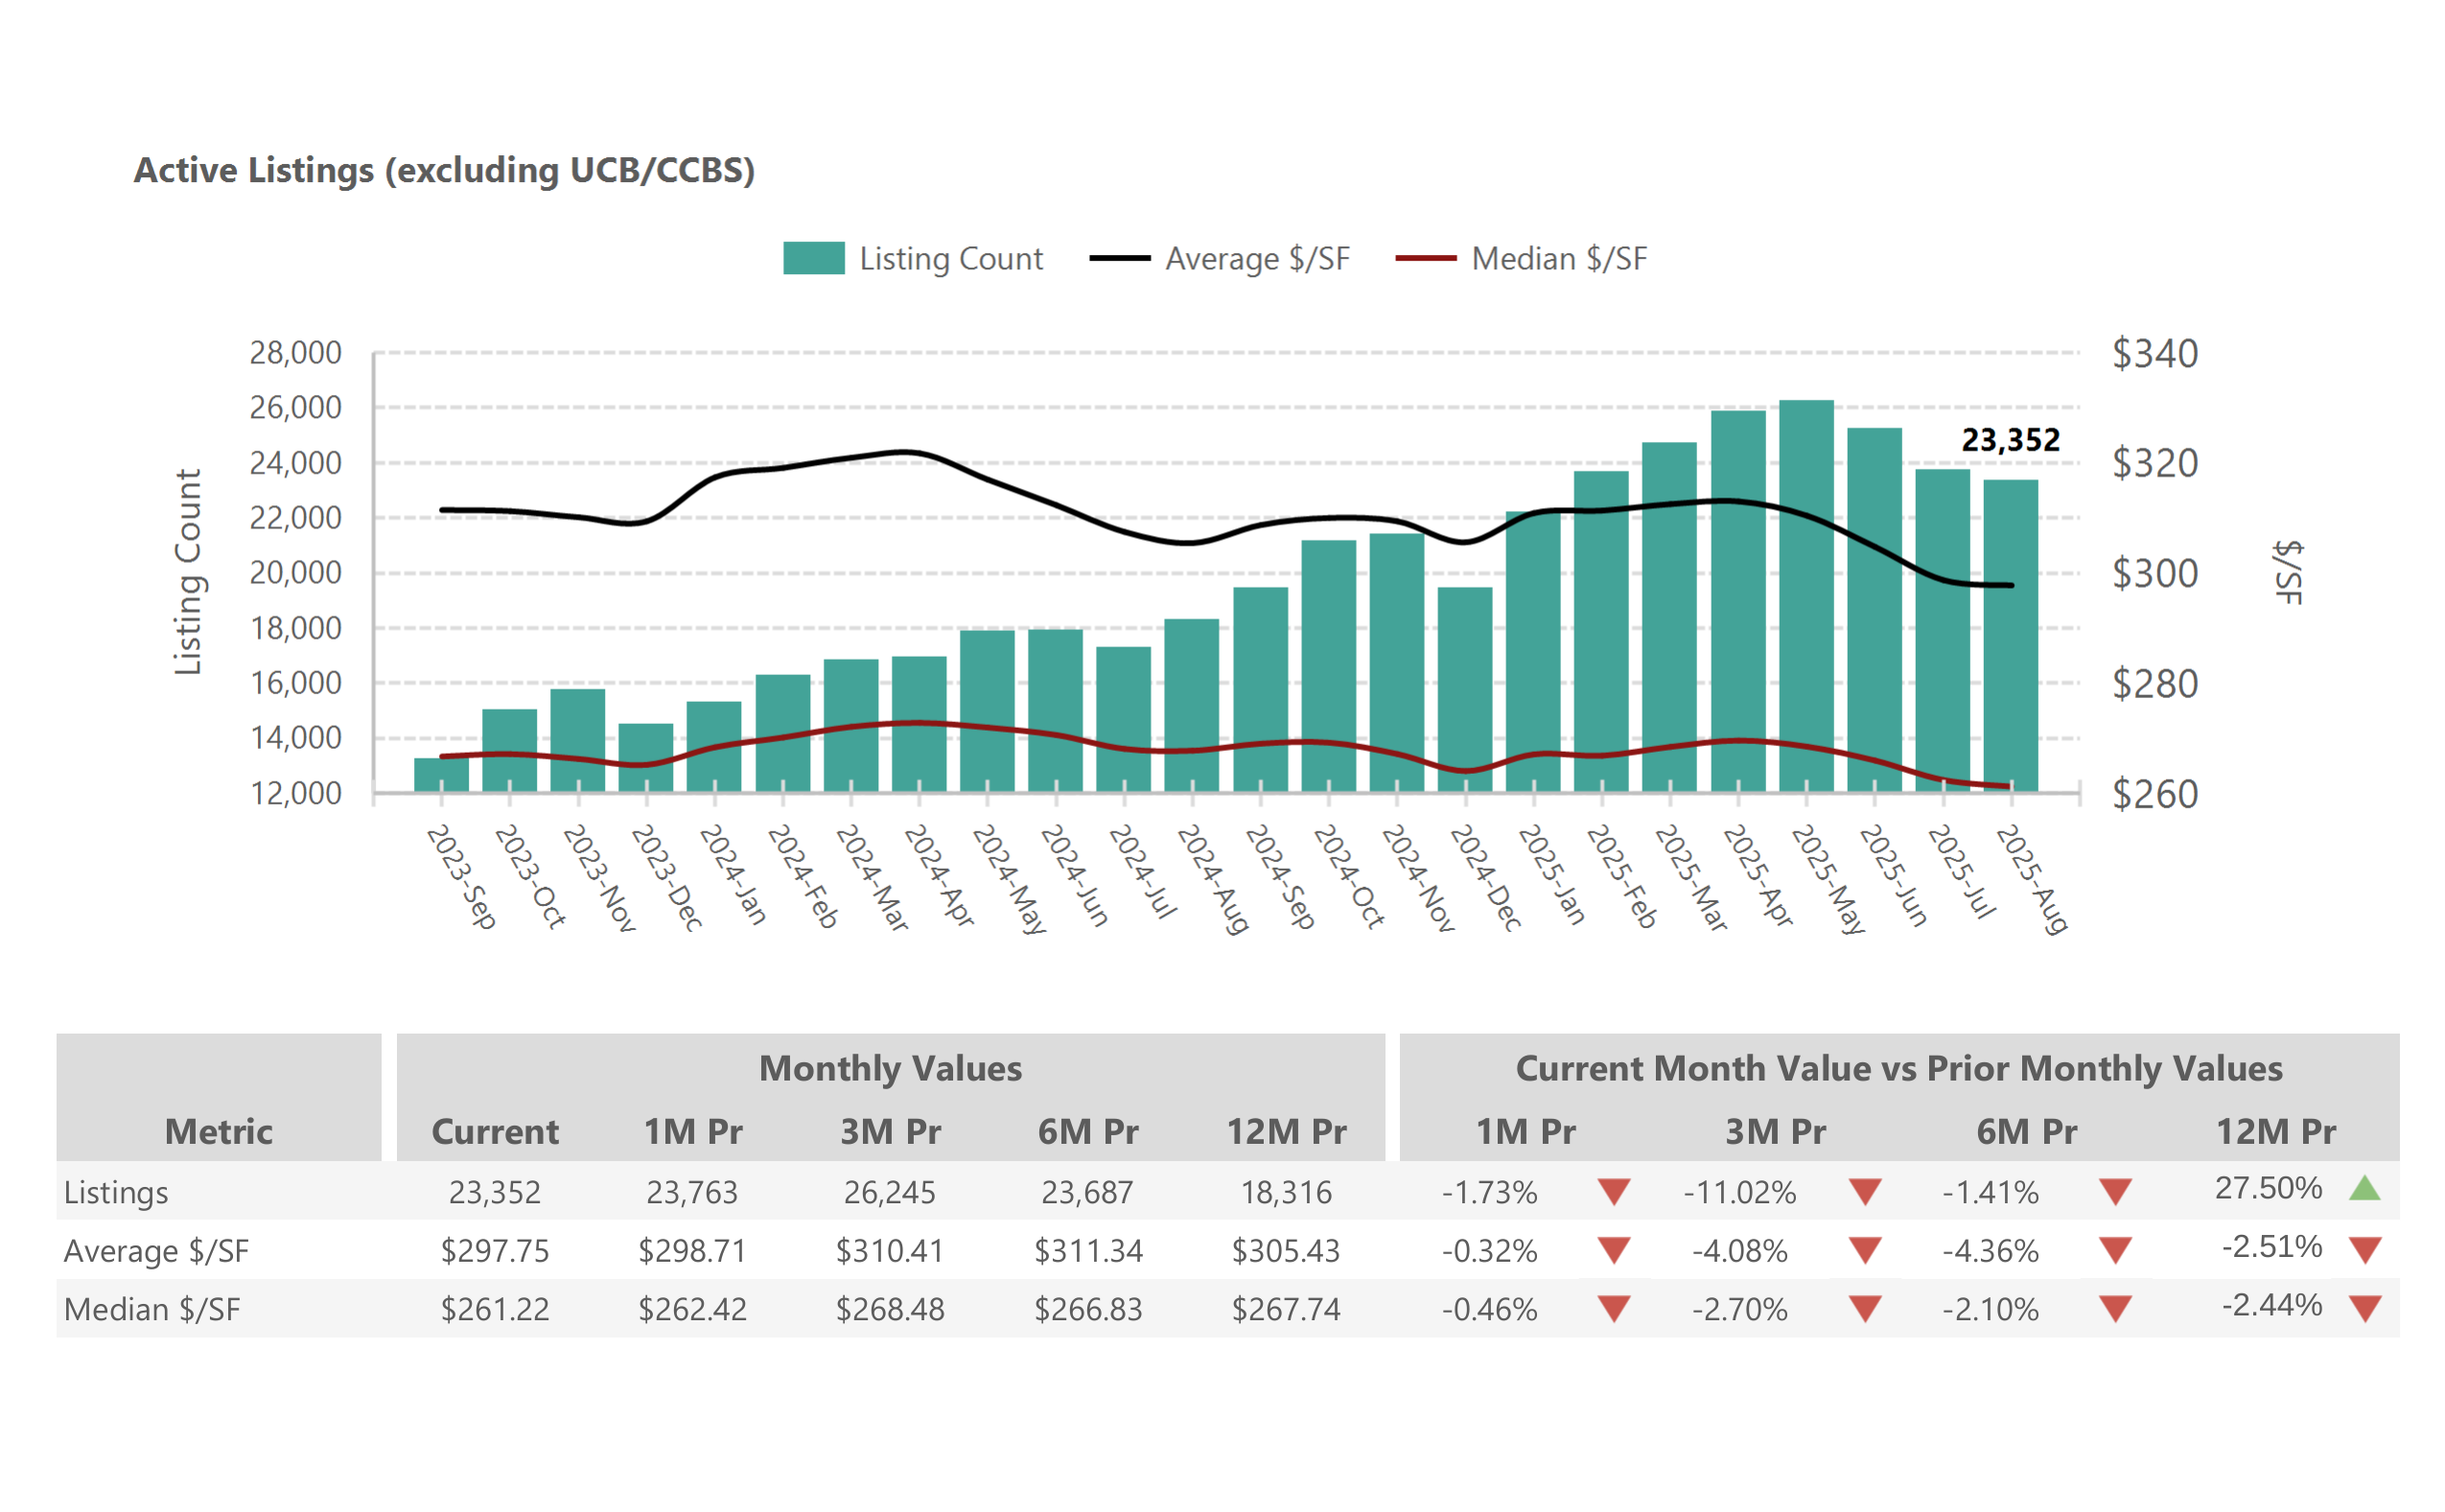
- Active inventory: 23,352 homes (+27.5% year-over-year)
- Days on market: 66 days median (+26.9% from 2024)
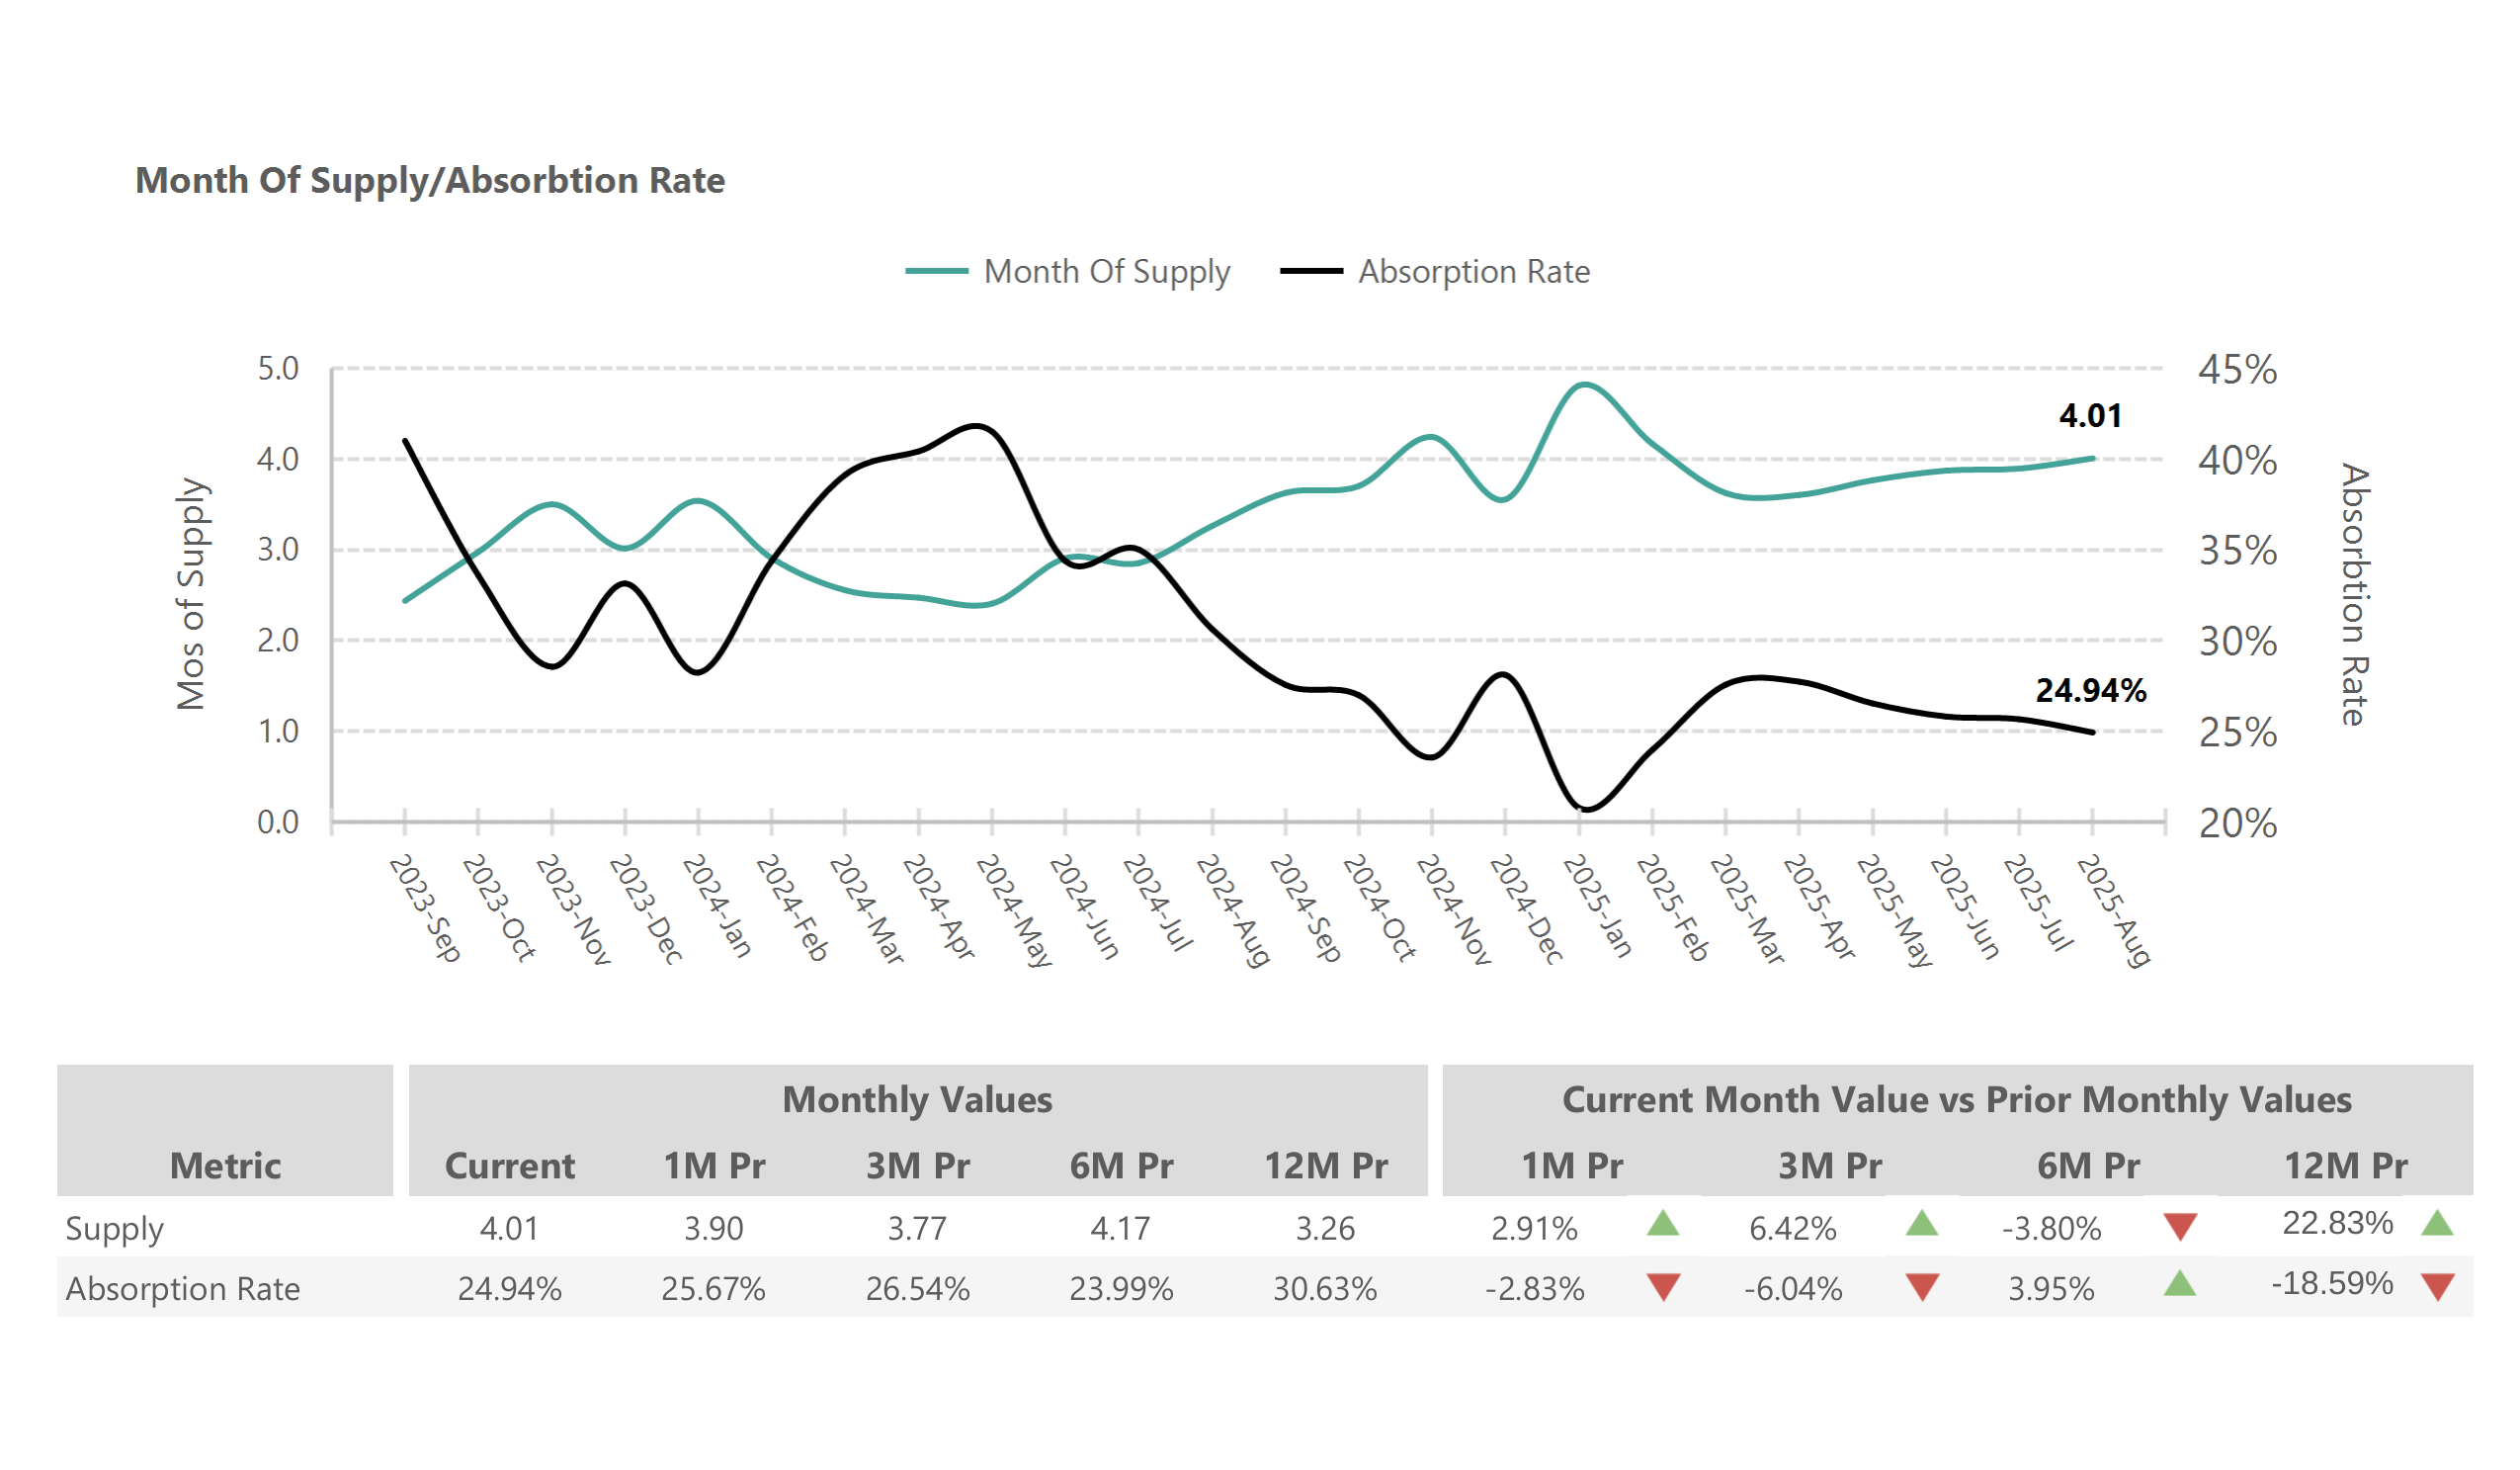
- Market supply: 4.01 months (+22.8% year-over-year)
- Sales volume: 7,133 homes sold (+10.8% from August 2024)
The market has shifted toward buyers with more choices and negotiating power, though it hasn’t reached full buyer’s market status. Sellers face increased competition but stable pricing, demonstrating the resilience of Phoenix’s underlying demand fundamentals. Buyers benefit from expanded inventory and reduced bidding wars, allowing for more thorough due diligence. This balanced environment rewards preparation and market knowledge over speed and emotional decision-making.
Phoenix Home Prices August 2025: Stability After the Storm
1- Current Pricing Trends
Phoenix home prices achieved remarkable stability in August 2025, with the median sales price holding exactly at $440,000 – identical to August 2024 levels. This price stability represents a significant shift from the volatility of recent years, when monthly price changes of 2-5% were common during both the pandemic boom and subsequent adjustment periods. The consistency in median pricing indicates that the Phoenix market has found its equilibrium point, where buyer purchasing power meets seller expectations. Market participants have adjusted their strategies to reflect this new reality, with buyers no longer expecting dramatic price drops and sellers accepting that unlimited appreciation is no longer feasible.
Price Metrics:
- Median Sales Price: $440,000 (0% change year-over-year)
- Average Sales Price: $559,229 (-1.5% from August 2024)
- Price per Square Foot (Active): $297.75 (-2.5% year-over-year)
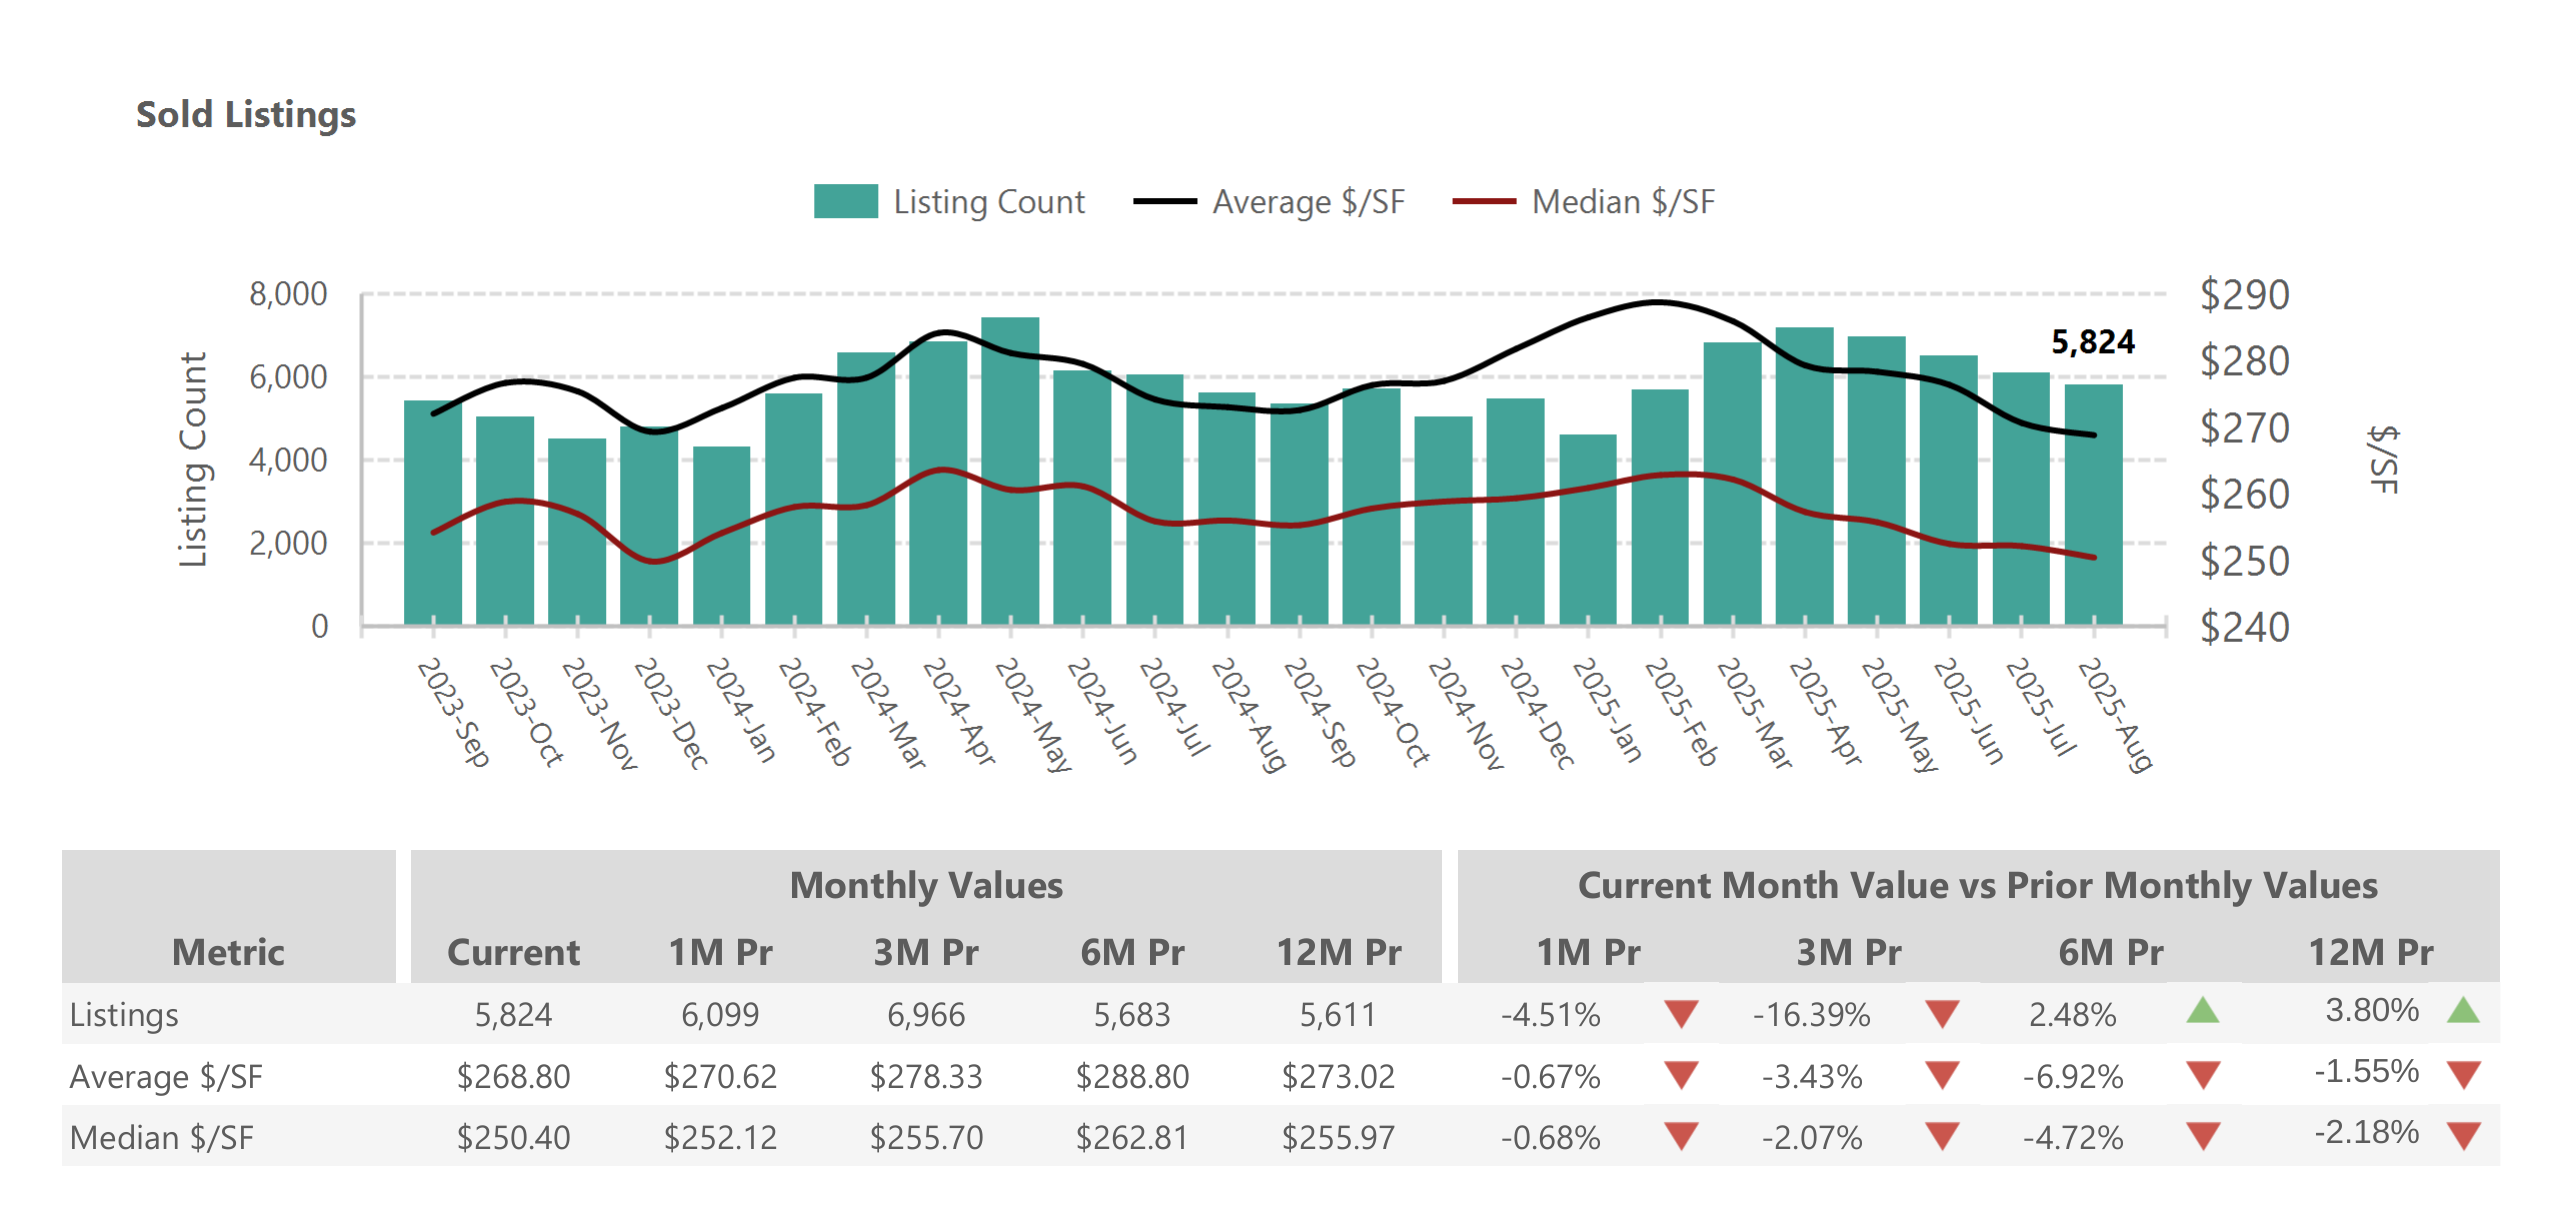
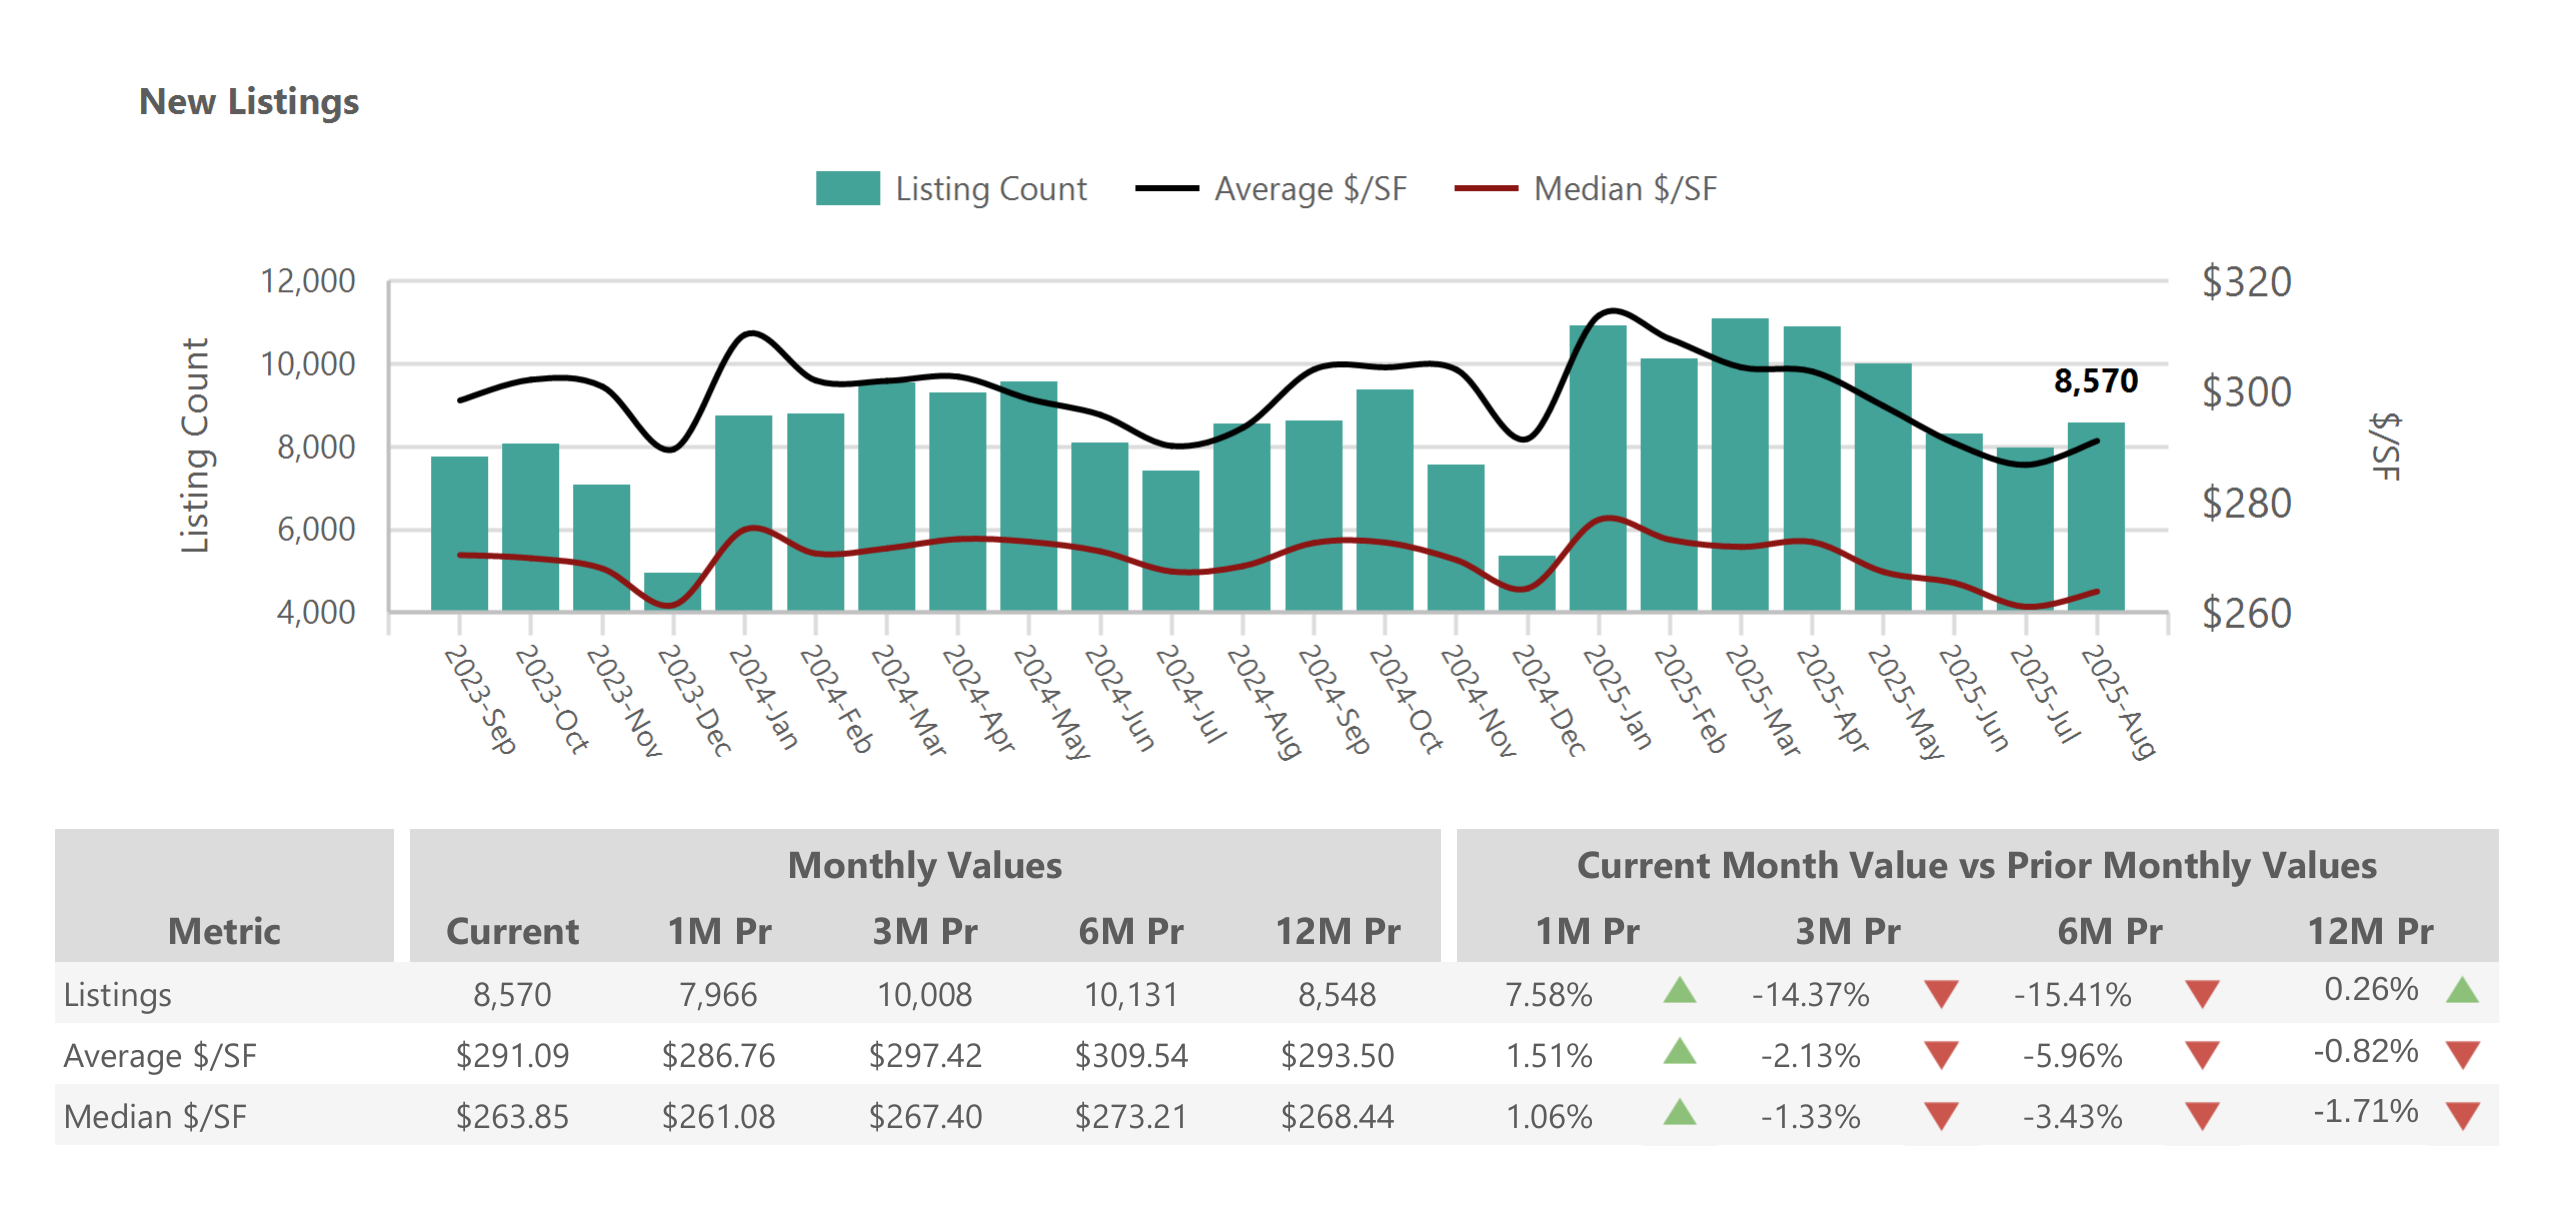
- Price per Square Foot (Sold): $291.09 (-0.8% year-over-year)
2- Historical Context
The current median price of $440,000 sits approximately 8% below Phoenix’s all-time peak of $480,000 reached in May 2022. However, this represents a controlled adjustment rather than a market crash, with prices stabilizing after the dramatic 40%+ increases experienced from 2020-2022. Unlike the 2008-2012 housing crisis, which saw Phoenix home values decline by over 50%, the current adjustment reflects market maturation rather than fundamental distress. This controlled price moderation demonstrates the market’s ability to self-correct without experiencing the devastating impacts that characterized the previous major downturn.
Average sales prices peaked earlier in 2025 at approximately $613,000 in February before settling back to current levels around $559,000. This 9% decline from peak reflects market recalibration as buyer affordability constraints and rising interest rates created natural price ceilings. The gap between average and median prices indicates that luxury properties experienced more significant price adjustments than entry-level and mid-market homes. The convergence of average and median price trends suggests the market is finding a more sustainable pricing structure that can withstand various economic conditions.
3- Neighborhood Price Variations
Phoenix market pricing shows significant variation by area, reflecting local amenities, school districts, employment proximity, and housing stock characteristics. South Phoenix maintains median prices around $465,000, benefiting from its accessibility to downtown employment centers and ongoing urban revitalization efforts. Encanto, with its tree-lined streets and historic character homes, commands premium pricing around $535,000 median. North Mountain areas offer more affordable entry points at approximately $375,000 median, while Alhambra presents the most accessible pricing at roughly $350,000 median.
These variations provide opportunities across different price points for various buyer segments. School district boundaries significantly influence pricing differentials, with homes in highly-rated districts commanding premiums of 10-20% over comparable properties. Proximity to major employment centers, including downtown Phoenix, Scottsdale’s corporate corridor, and Tempe’s technology hub, creates pricing gradients that help buyers balance commute times with housing costs.
Phoenix Housing Inventory Surge: 23,352 Active Listings
1- Record Inventory Growth
The most significant development in Phoenix’s August 2025 housing market is the dramatic 27.5% increase in active inventory compared to August 2024. With 23,352 homes currently available, buyers have more options than at any point in recent years, fundamentally altering market dynamics. This inventory surge represents the culmination of increased seller confidence, homeowners entering the market after delayed decisions, and new construction completions. The expansion in choices has psychological impacts beyond mere numbers, as buyers report feeling less pressure to make immediate decisions.
Inventory Metrics:
- Active Listings: 23,352 (+27.5% year-over-year)
- New Listings: 5,824 (+3.8% year-over-year)
- Months of Supply: 4.01 months (+22.8% year-over-year)
- Absorption Rate: 24.94% (-18.6% year-over-year)
2- Seasonal Patterns and Trends
Phoenix inventory typically peaks in late spring, and 2025 followed this pattern with over 26,000 active listings in May. The August level of 23,352 represents a seasonal decline but remains substantially elevated compared to the same period in previous years. This seasonal rhythm reflects both homeowner behavior patterns and market dynamics unique to Phoenix’s desert climate, where extreme summer heat traditionally reduces showing activity and seller motivation. However, the elevated inventory levels despite normal seasonal decline indicate structural changes in market supply that extend beyond weather-related factors. The persistence of high inventory through the traditionally slower summer months suggests that sellers are motivated to remain on the market rather than withdraw listings, indicating confidence in eventual sale completion despite longer marketing periods.
The absorption rate of 24.94% indicates that approximately one-quarter of available inventory sells each month, down from over 30% in August 2024. This slower absorption reflects the market’s transition from seller-favored to more balanced conditions, giving buyers additional time to evaluate options and make informed decisions. The decline in absorption rate correlates with extended days on market and increased negotiation activity, as transactions become more collaborative rather than competitive. Market professionals report that the slower pace allows for more thorough inspections, appraisal processes, and financing arrangements, potentially leading to more successful long-term homeownership outcomes. The measured absorption rate suggests a sustainable market pace that can accommodate both buyer due diligence and seller expectations without creating artificial urgency or pressure.
3- Supply and Demand Balance
With 4.01 months of supply, Phoenix approaches the 5-6 months typically considered a balanced market. This represents a significant shift from the sub-2 months of supply during peak seller’s market conditions in 2021-2022, when inventory was so constrained that bidding wars were routine and buyers often waived inspection contingencies. The current supply level indicates a market where buyers have reasonable choice without overwhelming sellers with excessive competition. Real estate economists consider 4-6 months of supply optimal for healthy market function, allowing adequate time for price discovery while maintaining transaction momentum. The trend toward balanced supply suggests that Phoenix is achieving sustainable market conditions that can withstand minor economic fluctuations without dramatic price swings.
The increased supply creates opportunities for buyers to compare multiple similar properties and negotiate repairs and concessions more effectively than during the seller’s market peak. Buyers can now take additional time for due diligence, including thorough property inspections, neighborhood research, and financing arrangements without fear of losing opportunities to more aggressive competitors. The reduced pressure environment allows for more strategic decision-making, as buyers can evaluate multiple options and make offers based on genuine property value rather than competitive dynamics. Most properties no longer experience bidding war scenarios, though well-priced homes in desirable locations may still receive multiple offers. This balanced approach benefits both parties by creating more sustainable transaction terms and reducing post-closing disputes related to rushed purchase decisions.
Days on Market: Homes Taking Longer to Sell
1- Extended Selling Times
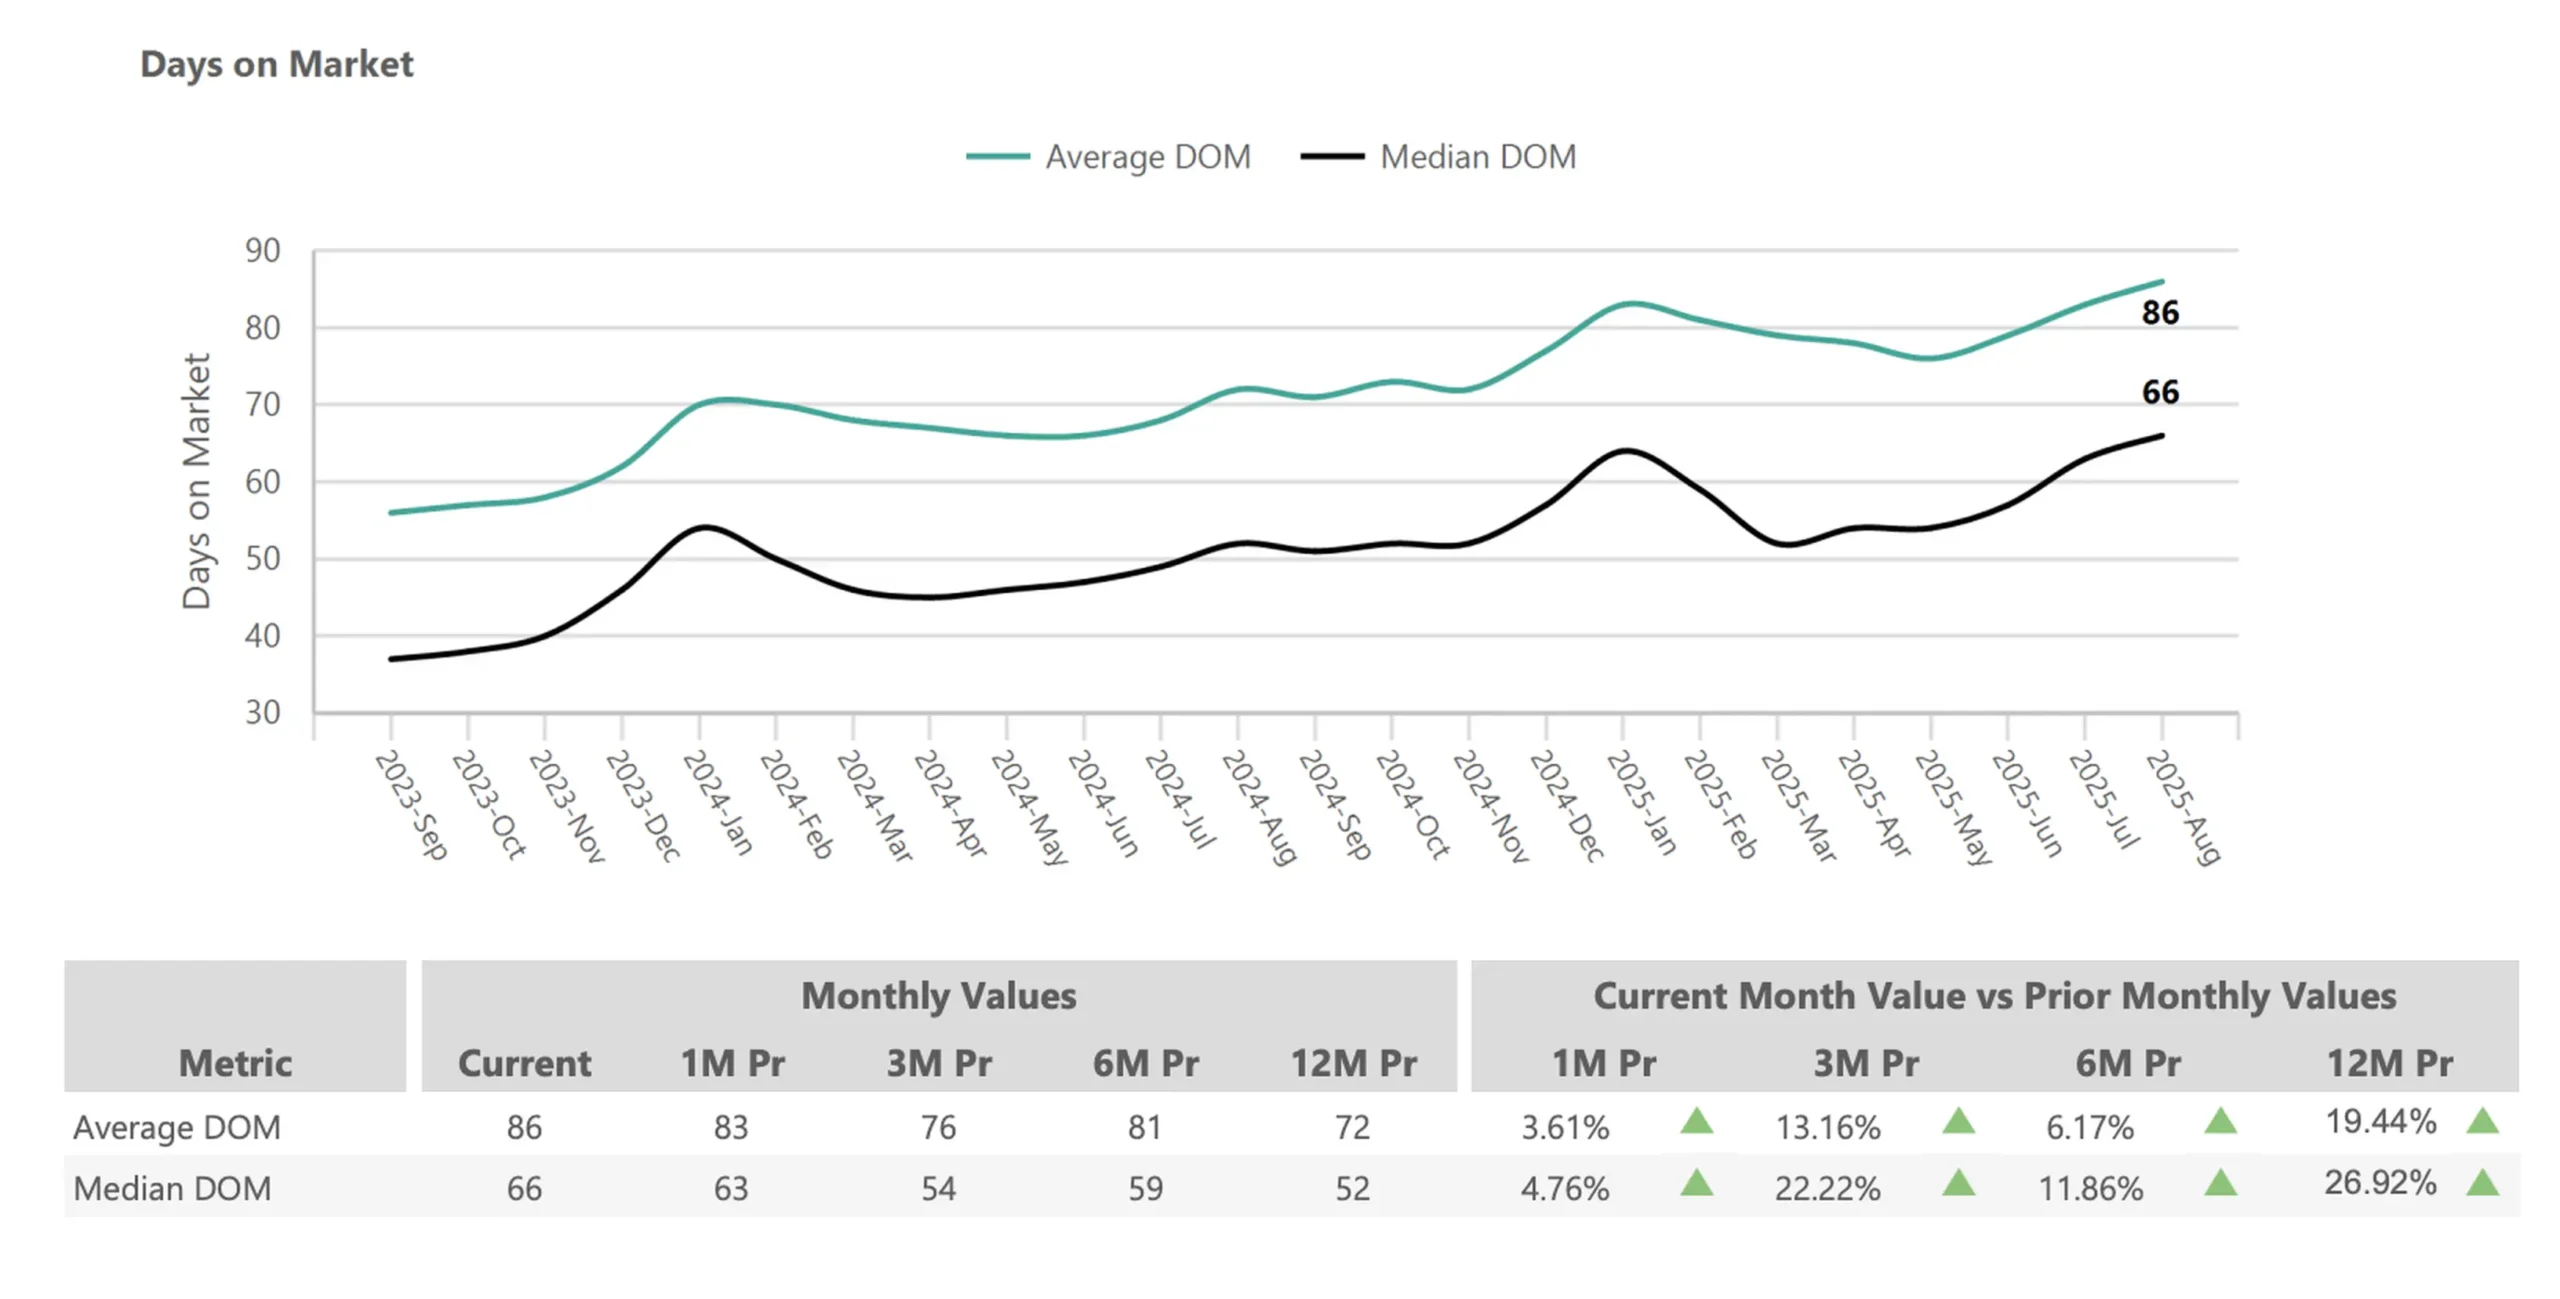
Phoenix homes are taking significantly longer to sell in August 2025, with median days on market reaching 66 days compared to 52 days in August 2024 – a 26.9% increase. The extended DOM reflects a fundamental shift in market psychology where buyers no longer feel pressure to make immediate decisions. Properties priced correctly for current market conditions typically receive offers within 2-4 weeks, while overpriced listings may sit for 60+ days before requiring price adjustments.
Days on Market Data:
- Median DOM: 66 days (+26.9% year-over-year)
- Average DOM: 86 days (+19.4% year-over-year)
- Month-over-month: +4.8% increase from July
2- Market Psychology Shift
The extended DOM reflects a fundamental shift in market psychology where buyers no longer feel pressure to make immediate decisions. Sellers must adjust pricing strategies to attract offers in a more competitive listing environment. The slower pace allows for more thorough inspections, appraisal processes, and financing arrangements.
Properties priced correctly for current market conditions typically receive offers within 2-4 weeks, while overpriced listings may sit for 60+ days before requiring price adjustments.
3- Strategic Implications
For sellers, longer DOM emphasizes the importance of:
- Accurate initial pricing based on recent comparable sales
- Professional staging and presentation
- Strategic marketing during the critical first 30 days
- Flexibility on repairs and concessions
For buyers, extended DOM provides opportunities to:
- Negotiate below asking price, especially on properties listed 30+ days
- Request seller-paid closing costs or home warranties
- Conduct thorough inspections without time pressure
Sales Activity and Market Velocity
1- Transaction Volume Growth
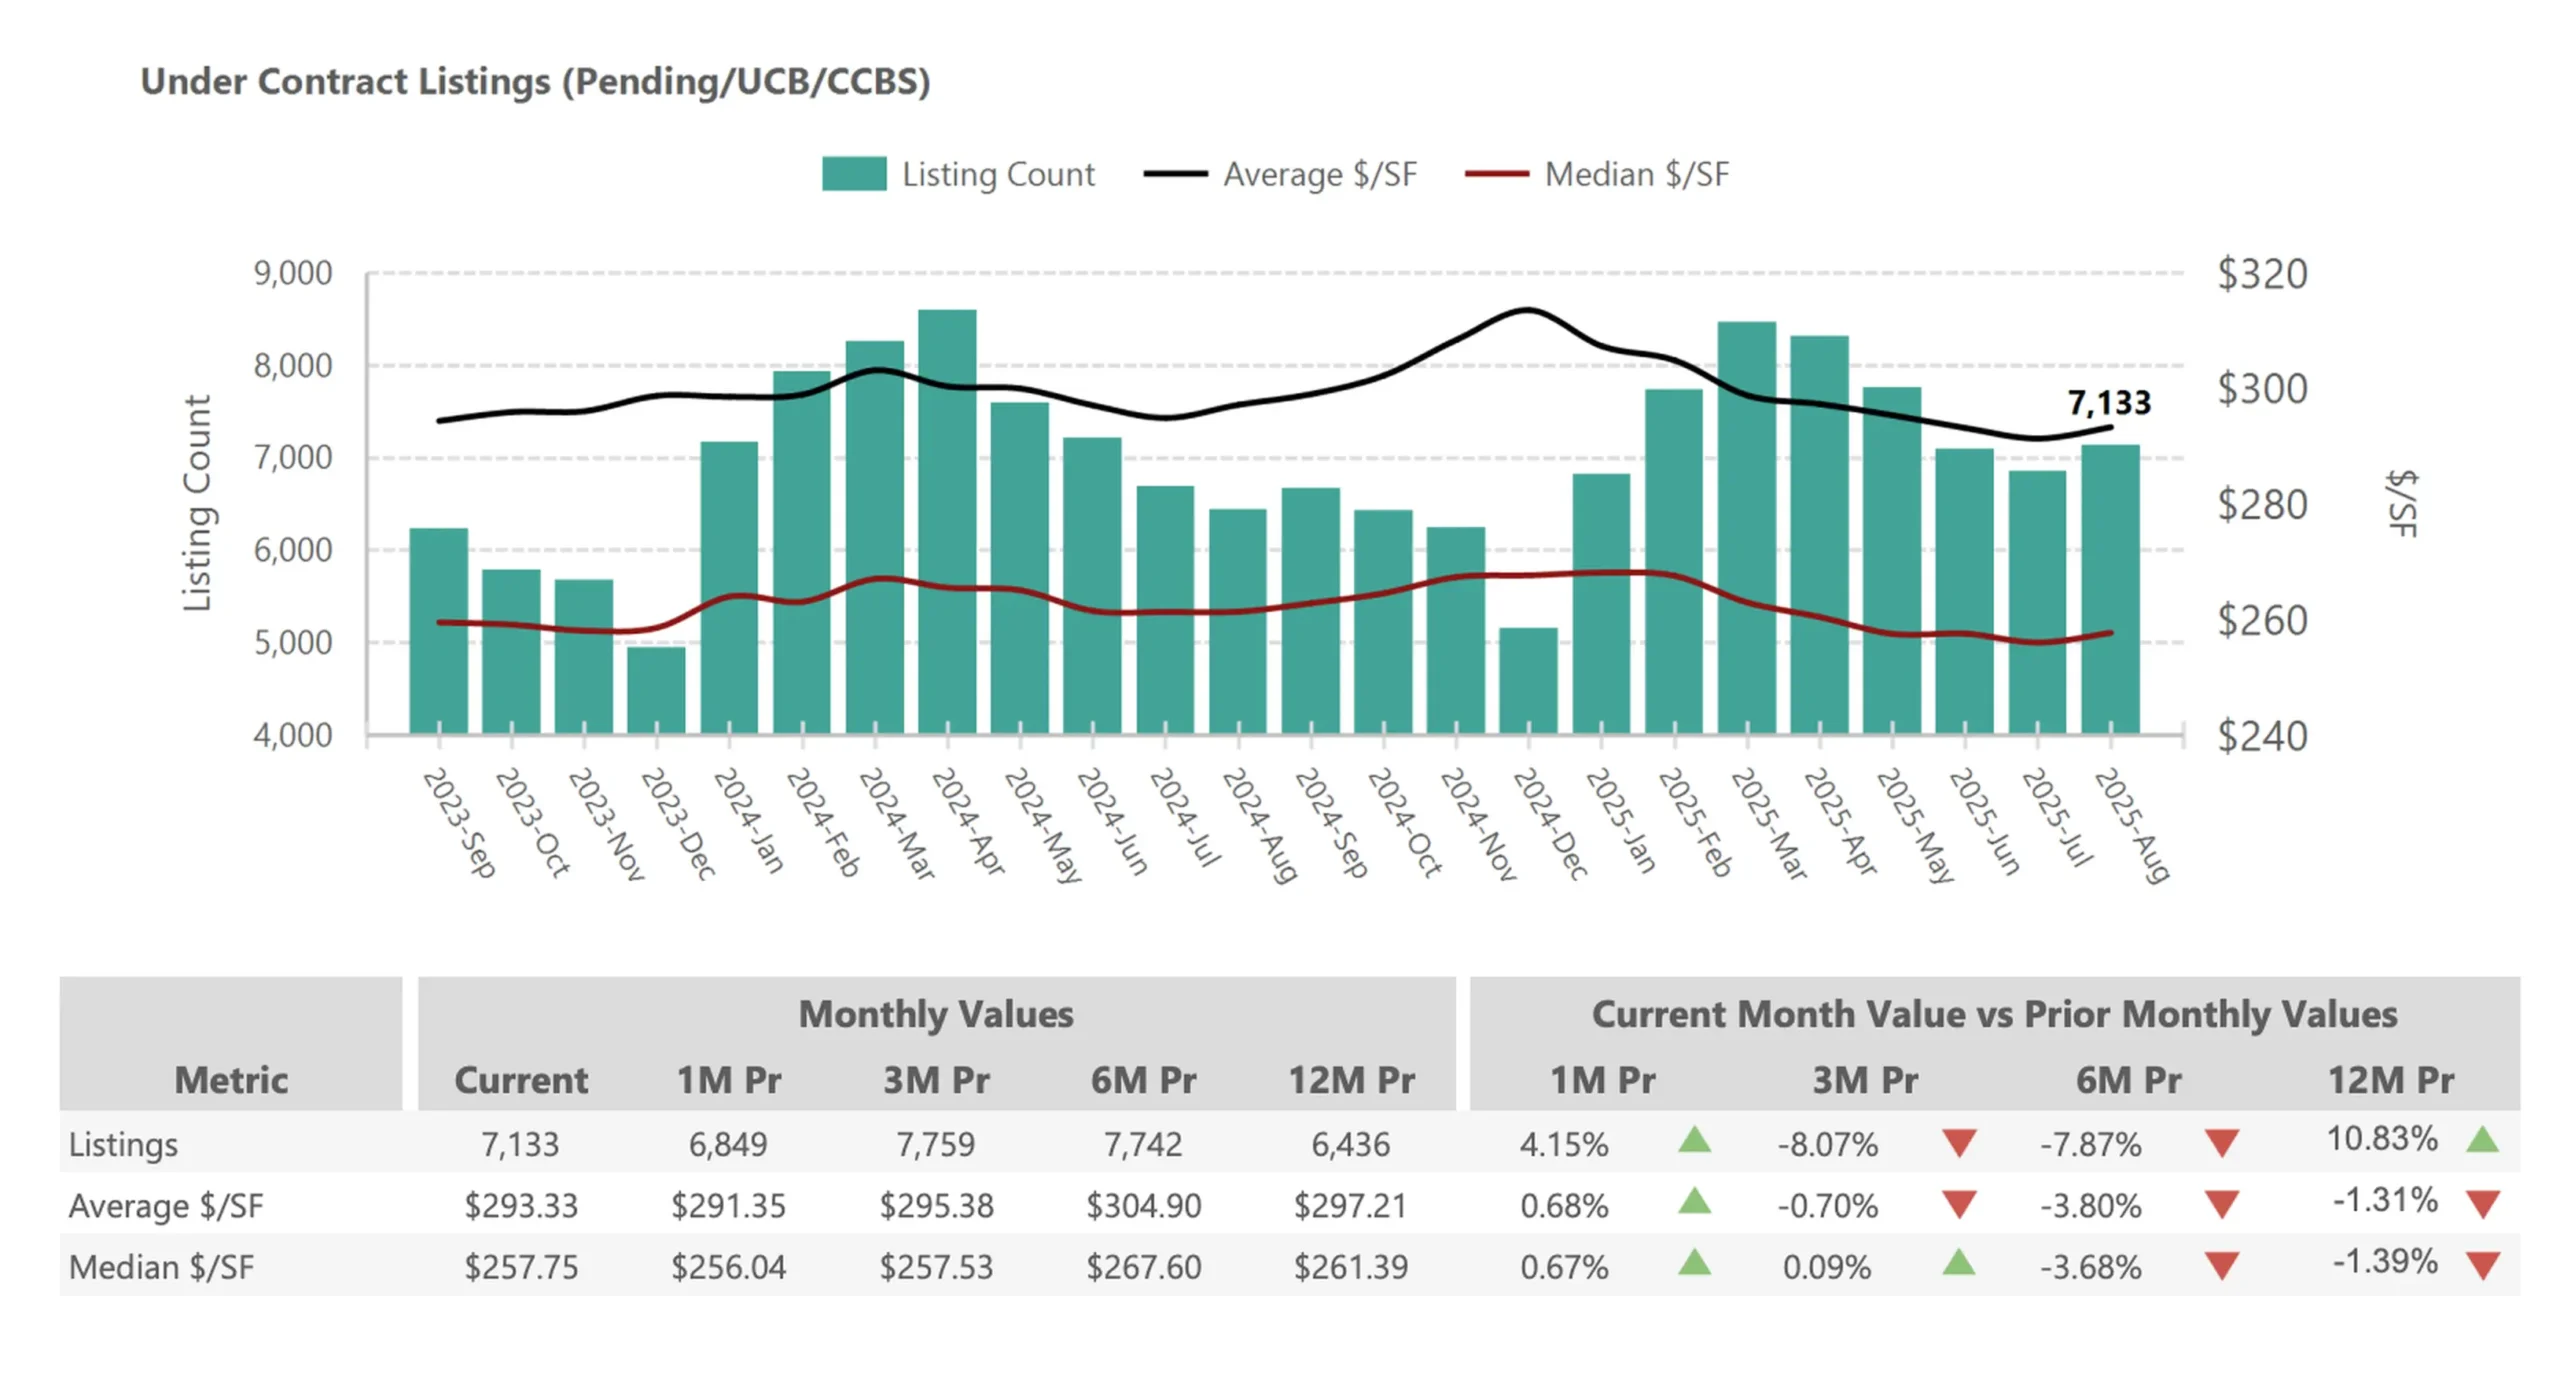
Despite longer selling times, Phoenix saw 7,133 home sales in August 2025, representing a 10.8% increase from August 2024. This growth indicates healthy underlying demand, even as market dynamics have shifted.
Sales Metrics:
- Closed Sales: 7,133 (+10.8% year-over-year)
- Pending Sales: 7,133 (+10.8% year-over-year)
- Sales Velocity: Moderate but consistent activity
2- Seasonal Considerations
August sales activity in Phoenix faces headwinds from:
- Extreme heat (multiple 110°F+ days) limiting showing activity
- Back-to-school timing as families avoid mid-year moves
- Seasonal buyer fatigue following spring/early summer search periods
The 10.8% year-over-year increase demonstrates resilient demand despite these seasonal challenges and higher interest rate environment.
3- Market Segmentation
Entry-level market (under $400K) remains most competitive due to limited inventory in this price range and strong first-time buyer demand.
Move-up market ($400K-$650K) shows balanced conditions with reasonable inventory and steady buyer activity.
Luxury market ($650K+) experiences softer conditions with higher inventory levels and more negotiation opportunities.
Phoenix Housing Market Data Tables
1- Key Market Metrics Summary - August 2025
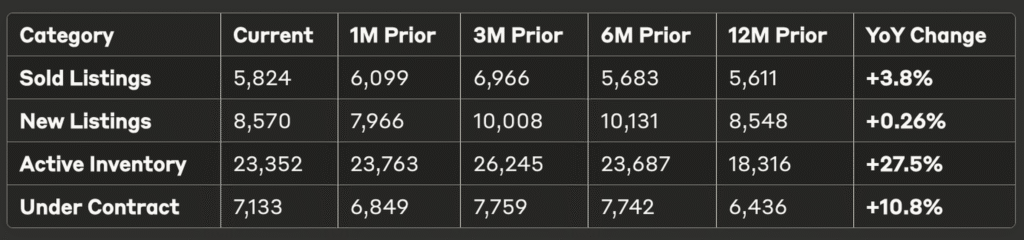
2- Listing Activity Breakdown - August 2025
3- Interest Rate Environment
Mortgage rates averaging around 7% continue to impact buyer purchasing power. However, many buyers have adjusted expectations and are proceeding with purchases, leading to the 10.8% increase in sales volume.
Rate impact strategies buyers are employing include:
- Considering adjustable-rate mortgages for lower initial payments
- Negotiating seller-paid rate buydowns
- Planning to refinance if rates decline in future periods
4 -Migration and Population Growth
Phoenix continues benefiting from domestic migration, particularly from California and other high-cost states. However, the pace has moderated from pandemic-era peaks as housing costs have increased.
Current migration patterns show:
- Continued California exodus supporting demand
- Corporate relocations maintaining buyer pipeline
- Reduced investor activity compared to 2021-2022 levels
5 - Employment Market Strength
Phoenix’s diverse economy continues supporting housing demand through:
- Technology sector expansion
- Manufacturing and logistics growth
- Healthcare and education sector stability
- Tourism industry recovery
Neighborhood Analysis: Hyperlocal Market Conditions
1 - High-Performance Areas
Scottsdale
Maintains premium pricing with median prices in the $650K+ range, supported by luxury amenities and resort lifestyle appeal.
Tempe
Shows strong fundamentals driven by Arizona State University proximity and tech industry presence, with median prices around $525K.
Chandler
Benefits from corporate headquarters and master-planned communities, maintaining price stability in the $575K median range.
2 - Value Opportunities
South Phoenix
Offers relative affordability with median prices around $465K while providing access to downtown employment centers.
West Valley communities
Including Glendale and Peoria present entry-level opportunities with medians in the $400-450K range.
3 - Emerging Markets
North Phoenix areas near the 101 freeway are seeing increased development activity and buyer interest as infrastructure improvements reduce commute times.
Market Outlook: What to Expect Through Fall 2025
1- Short-Term Projections (Next 3 Months)
Seasonal patterns suggest:
- Inventory may increase further as fall listings hit market
- Buyer activity traditionally slows in October-November
- Price stability likely to continue with minimal volatility
2- Interest Rate Sensitivity
Market conditions remain sensitive to interest rate changes:
- Rate decreases could quickly tighten inventory and increase competition
- Rate increases might further extend DOM and shift market toward buyers
- Rate stability supports continued market balance
3- Supply and Demand Balance
The trend toward market equilibrium likely continues with:
- Months of supply potentially reaching 5-6 month balanced range
- New construction providing additional inventory relief
- Seller expectations adjusting to current market realities
Actionable Advice for Market Participants
For Buyers
Opportunities in Current Market:
- More inventory provides better selection and comparison opportunities
- Extended DOM creates negotiation leverage on pricing and concessions
- Reduced bidding wars allow for thorough due diligence
Strategic Recommendations:
- Get pre-approved to move quickly on preferred properties
- Focus on well-priced homes in good condition for fastest transactions
- Consider newer listings while monitoring properties with extended DOM
- Negotiate repairs, closing costs, or rate buydowns
For Sellers
Current Market Realities:
- Increased competition requires strategic pricing and presentation
- Extended marketing timelines should be planned and budgeted
- Buyer concessions may be necessary to secure sales
Success Strategies:
- Price competitively based on recent comparable sales
- Invest in professional staging and photography
- Prepare for 60-90 day marketing timeline
- Remain flexible on repairs and closing cost assistance
For Investors
Market Opportunities:
- Extended DOM properties may offer below-market purchase opportunities
- Rental demand remains strong supporting buy-and-hold strategies
- Fix-and-flip opportunities require conservative exit pricing assumptions
Risk Management:
- Maintain 10-15% equity cushion on renovation projects
- Focus on cash-flow positive rental properties
- Consider build-to-rent opportunities in suburban locations
Phoenix Housing Market Video Update
Watch our August 2025 Phoenix Housing Market Update for a quick, visual breakdown of the numbers behind this month’s report. In just a few minutes, you’ll see:
Conclusion: A Balanced Market Emerges
The Phoenix housing market in August 2025 represents a healthy recalibration from the extreme conditions of recent years. Price stability combined with increased inventory creates opportunities for both buyers and sellers, though success requires adapting strategies to current market dynamics.
Key market themes include:
- Stabilization over volatility – dramatic price swings have ended
- Choice over scarcity – buyers have meaningful options
- Strategy over speed – success requires planning and execution
- Balance over extremes – neither buyers nor sellers hold complete advantage
This market environment rewards participants who understand current conditions and adapt their approaches accordingly. While the frenzy of 2021-2022 has ended, Phoenix’s fundamental growth drivers remain intact, supporting long-term housing demand and market stability.
For market updates and personalized analysis, contact the Phoenix real estate experts at PhoenixHomes.com. Our team provides current market intelligence and strategic guidance to help you succeed in today’s evolving market conditions.