
The Phoenix housing market in September 2025 continues to show balanced conditions with stable to slightly rising home prices and significantly higher inventory than a year ago. After several years of extreme seller’s market conditions, Greater Phoenix has settled into a more normalized environment where buyers have more choices and time, and sellers face increased competition. Home prices posted modest gains year-over-year while active listings remain elevated, indicating that underlying demand remains resilient despite higher interest rates and greater supply. This report builds on insights from the August 2025 Phoenix Housing Market Report and highlights the latest trends for buyers, sellers, and investors in the Greater Phoenix real estate market.
Key Takeaways:
Median home price: $450,000 (+2.3% year-over-year) – a slight increase from September 2024, signaling price stability with modest appreciation.
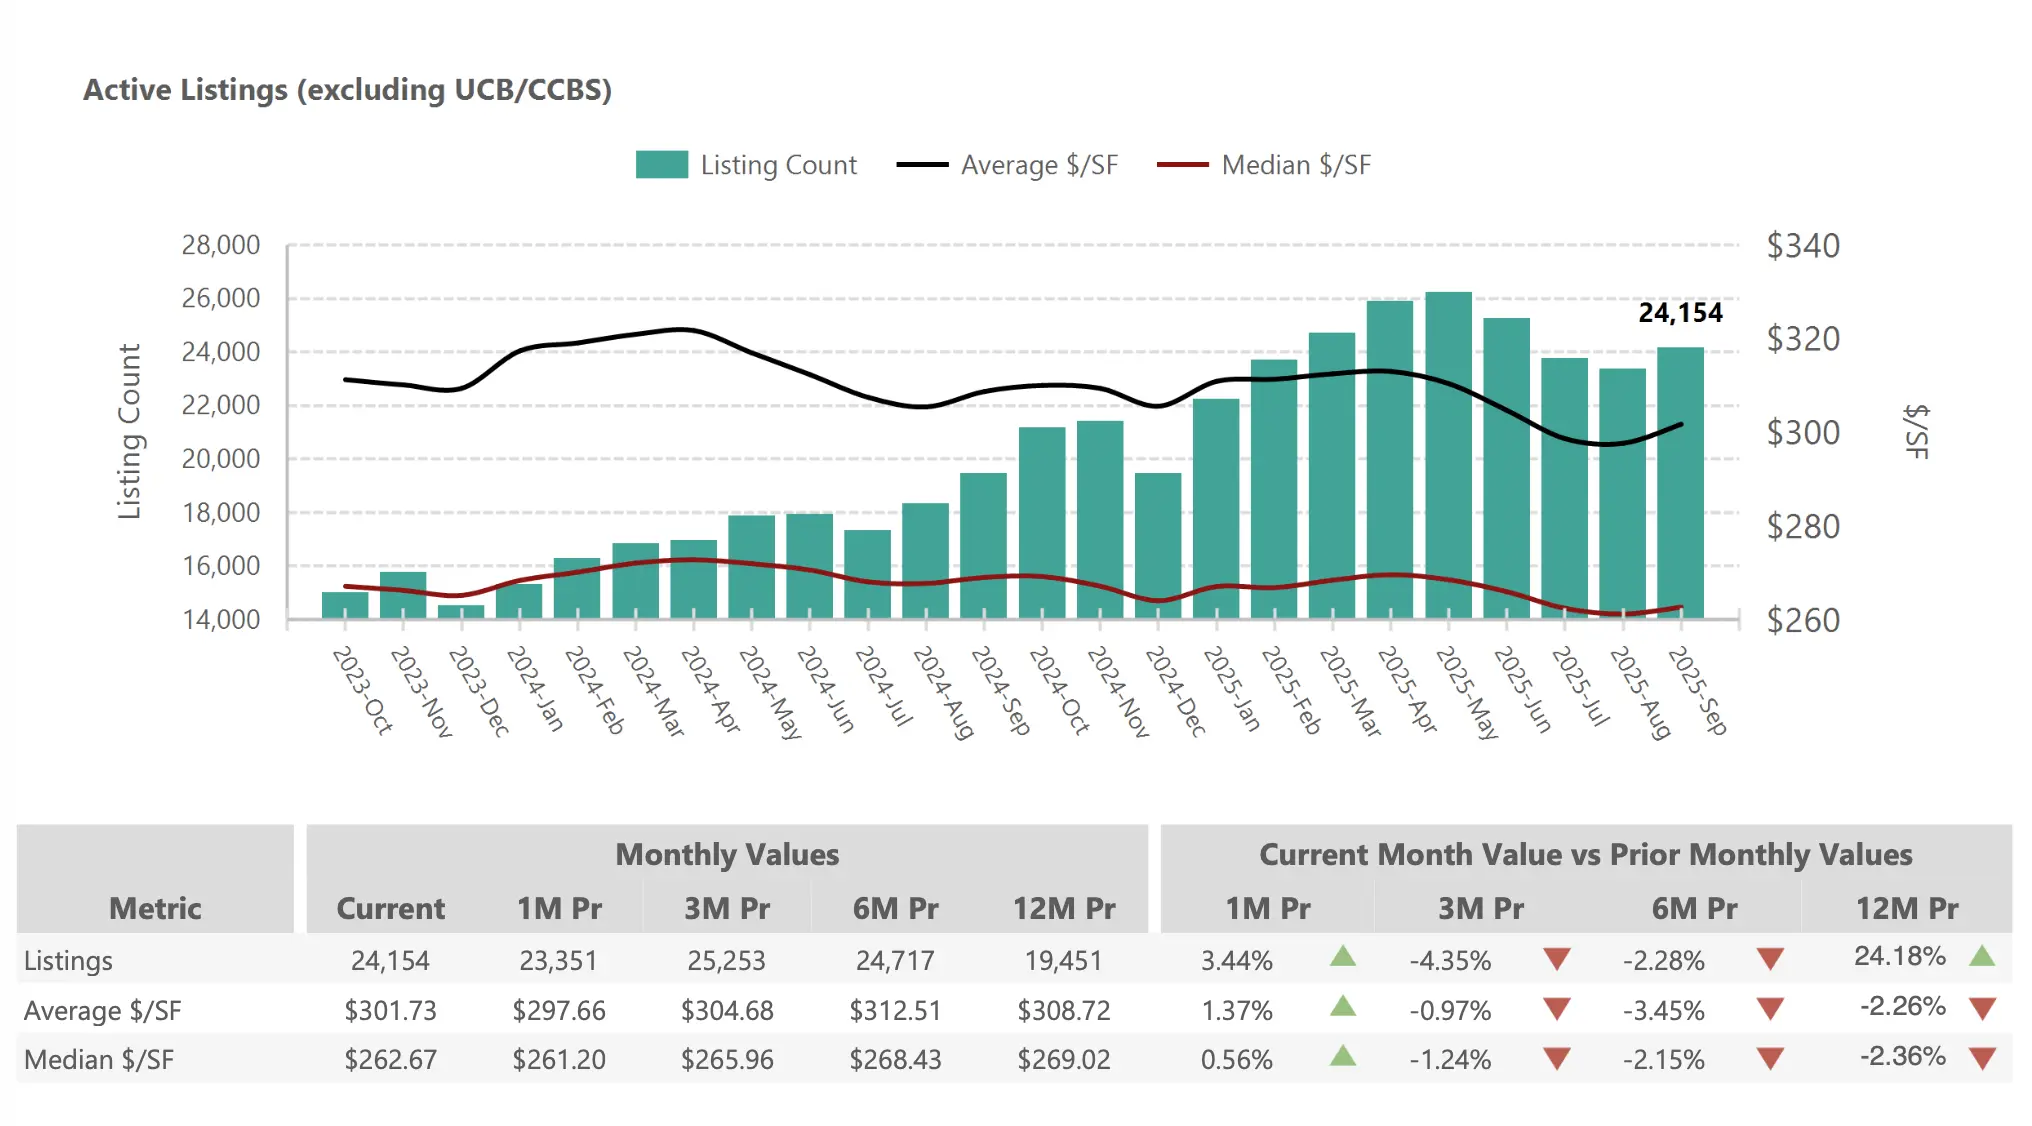
Active inventory: 24,154 homes (+24% year-over-year) – a dramatically higher supply of homes for sale versus last year, giving buyers far more options.
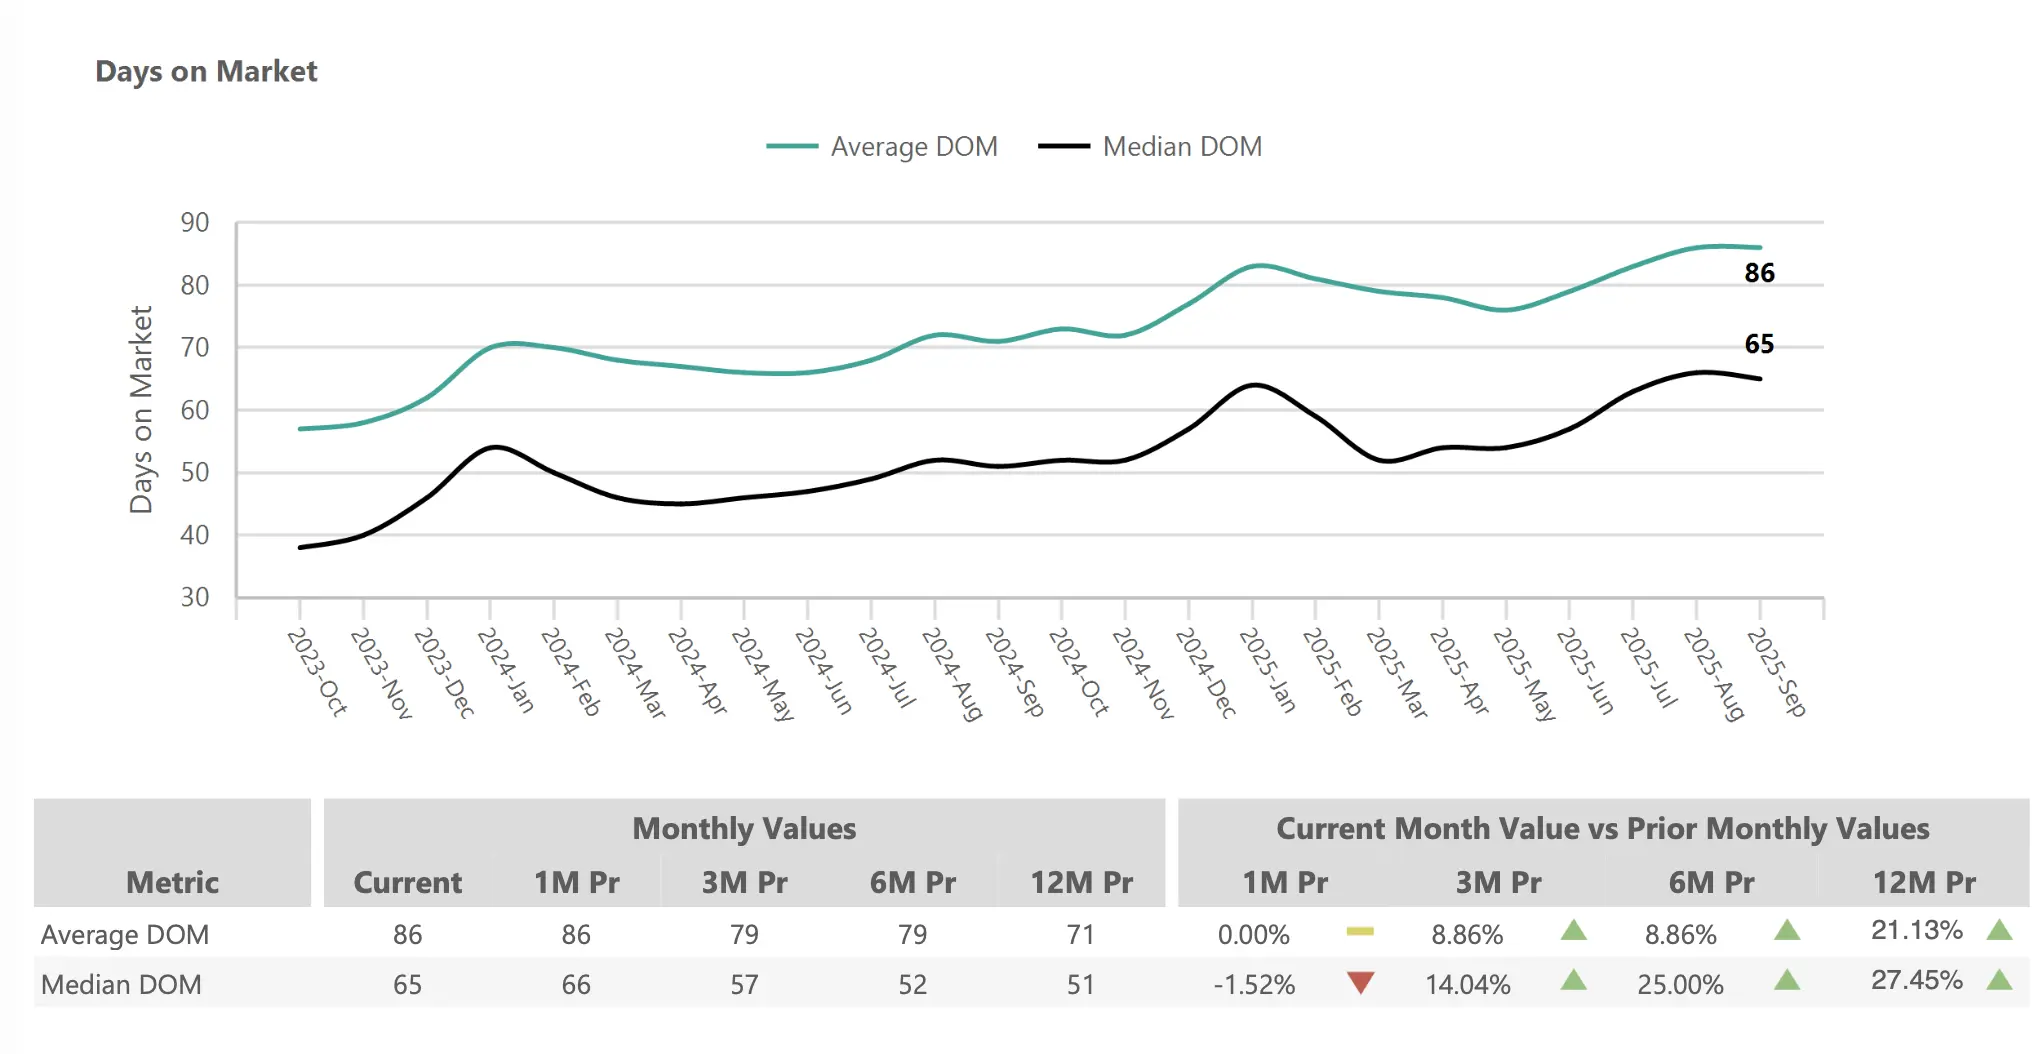
Days on market: 65 days median (+27% from Sept 2024) – homes are taking several weeks longer to sell on average than they did a year ago.
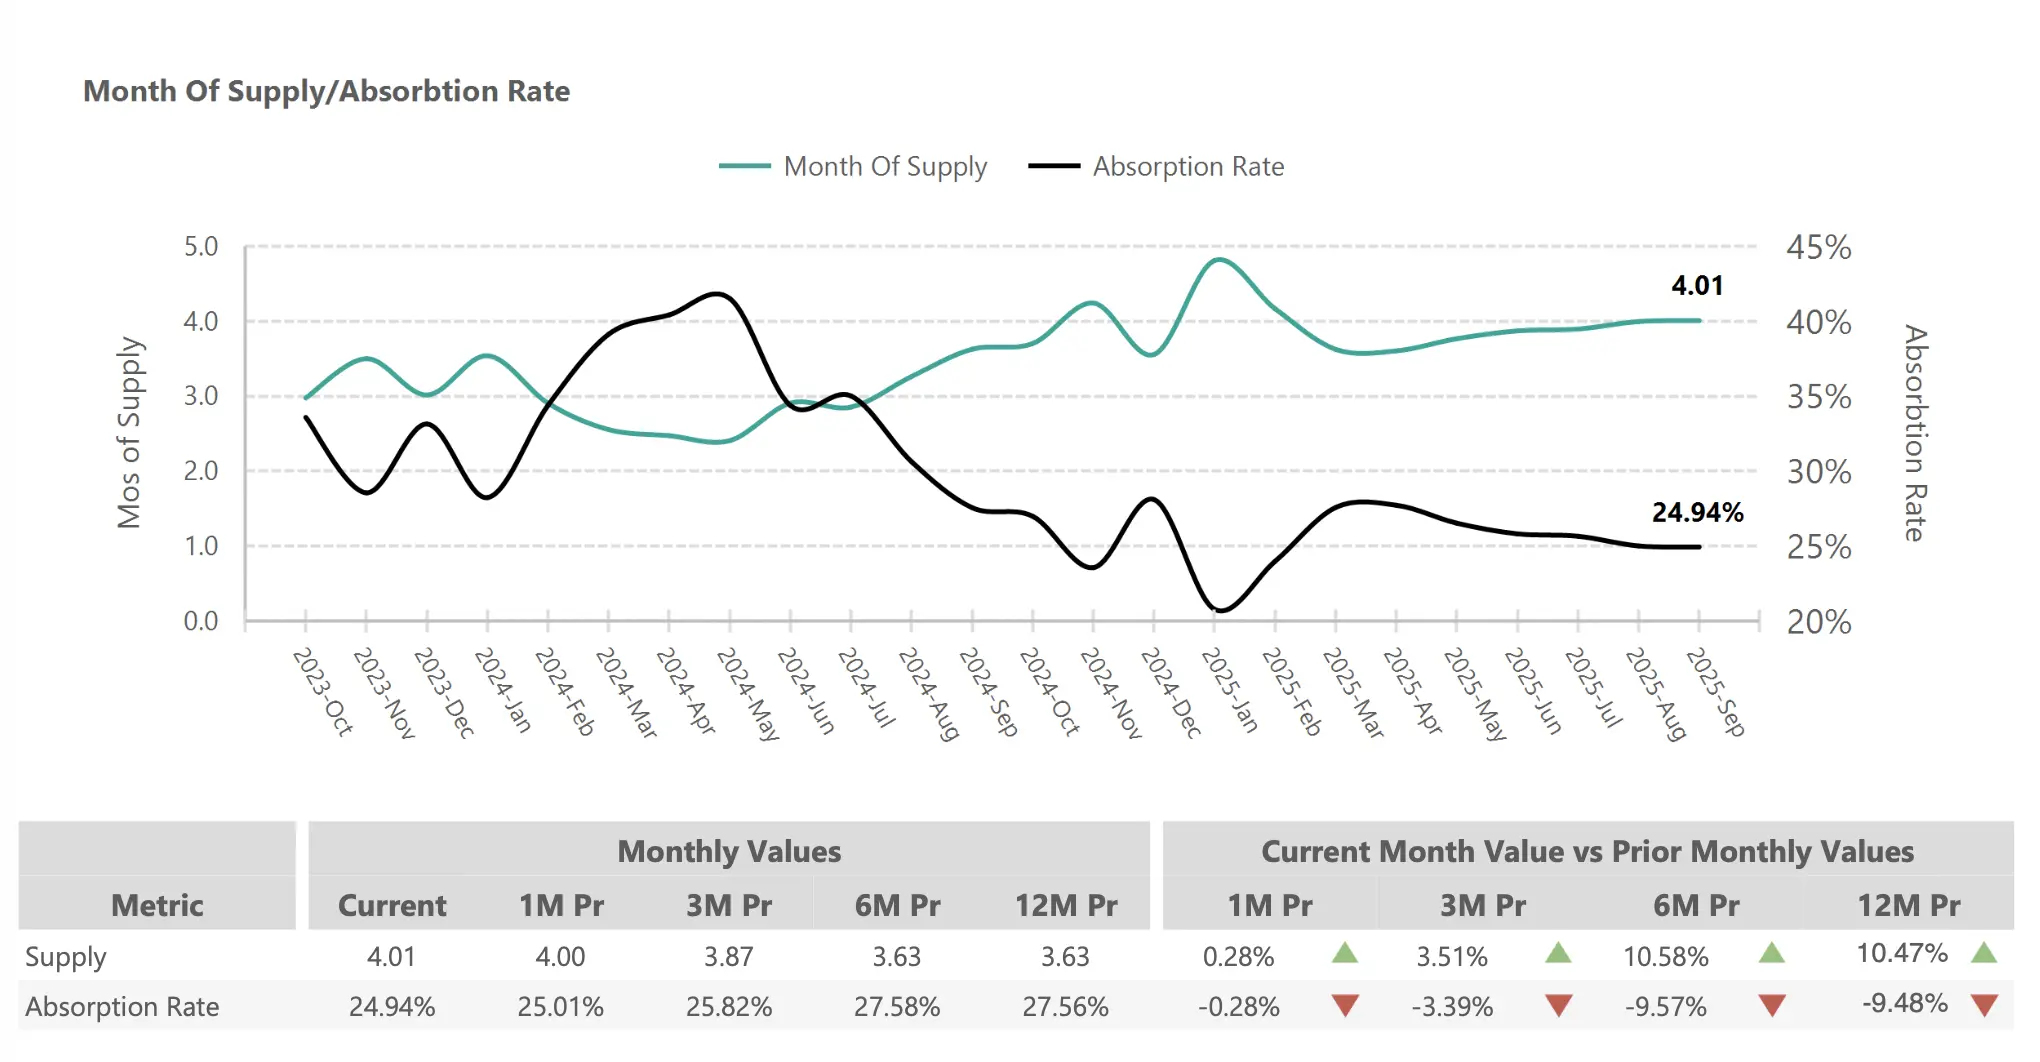
Market supply: 4.01 months (+10.5% year-over-year) – available housing supply is around four months, edging closer to a balanced 5–6 month level.
Sales volume: 6,861 homes sold (+2.9% from Sept 2024) – slightly more sales closed than a year ago, reflecting steady buyer demand even as the market normalizes.
The market’s transition toward balance that began earlier in 2025 is fully evident this fall. Buyers benefit from expanded inventory and reduced competition, gaining the ability to thoroughly compare homes and negotiate terms. Sellers, meanwhile, face more competition and longer selling times but enjoy stable prices supported by Phoenix’s enduring housing demand. Higher mortgage rates have tempered the frenzy of 2021-2022, yet strong local economy and population growth continue to underpin the market. Overall, Phoenix real estate in September 2025 offers a healthier dynamic where neither side holds an extreme advantage, and success comes from strategic preparation and realistic expectations rather than sheer speed or bidding wars.
Phoenix Home Prices September 2025: Modest Gains in a Balanced Market
1- Current Pricing Trends
Phoenix home prices showed remarkable resilience in September 2025, with the median sales price rising to $450,000, a 2.3% increase year-over-year. This marks a shift to modest annual appreciation after the flat prices seen in August. The average sales price similarly reached $575,134, up ~2.5% from September 2024. These small gains indicate that despite higher interest rates and greater inventory, buyer demand remains strong enough to support slight price growth. Month-to-month, prices also ticked upward – September’s median was about $10K higher than August’s $440K median – suggesting a late-summer boost in purchasing activity. Importantly, no significant price declines have materialized; instead, values are holding steady or inching up, reflecting a market that has found equilibrium between what buyers can afford and what sellers are willing to accept.
Price Metrics:
Median Sales Price: $450,000 (+2.3% year-over-year)
Average Sales Price: $575,134 (+2.5% year-over-year)
Price per Square Foot (Active Listings): $301.73 (-2.3% year-over-year) – average asking price per sqft for active listings (down slightly from $308.72 in Sept 2024)
Price per Square Foot (Sold Homes): $297.03 (-0.6% year-over-year) – average sold price per sqft (virtually unchanged from $298.96 a year ago)
2- Historical Context
The current median price of $450K remains about 6% below Phoenix’s all-time high of roughly $480K reached in May 2022. However, this moderate dip from the peak represents a controlled adjustment rather than a crash, especially when compared to past downturns. During the 2008–2011 housing crisis, Phoenix home values plummeted over 50%. In contrast, the recent correction has been minor – a gentle deflation of the pandemic price surge rather than a burst bubble. After the explosive 20–30% annual price jumps of 2021, the market cooled and found a sustainable plateau. Buyer purchasing power, constrained by higher mortgage rates, has kept prices in check, but ongoing population and job growth in the Valley ensured there was no free-fall. Now, with two straight months of year-over-year price stability or growth, the Phoenix market appears to have hit its floor and begun a slight upward climb. Both buyers and sellers have adjusted to the new normal of mid-7% interest rates, and Phoenix’s housing demand fundamentals – job creation, in-migration, and household formation – are providing a floor under prices.
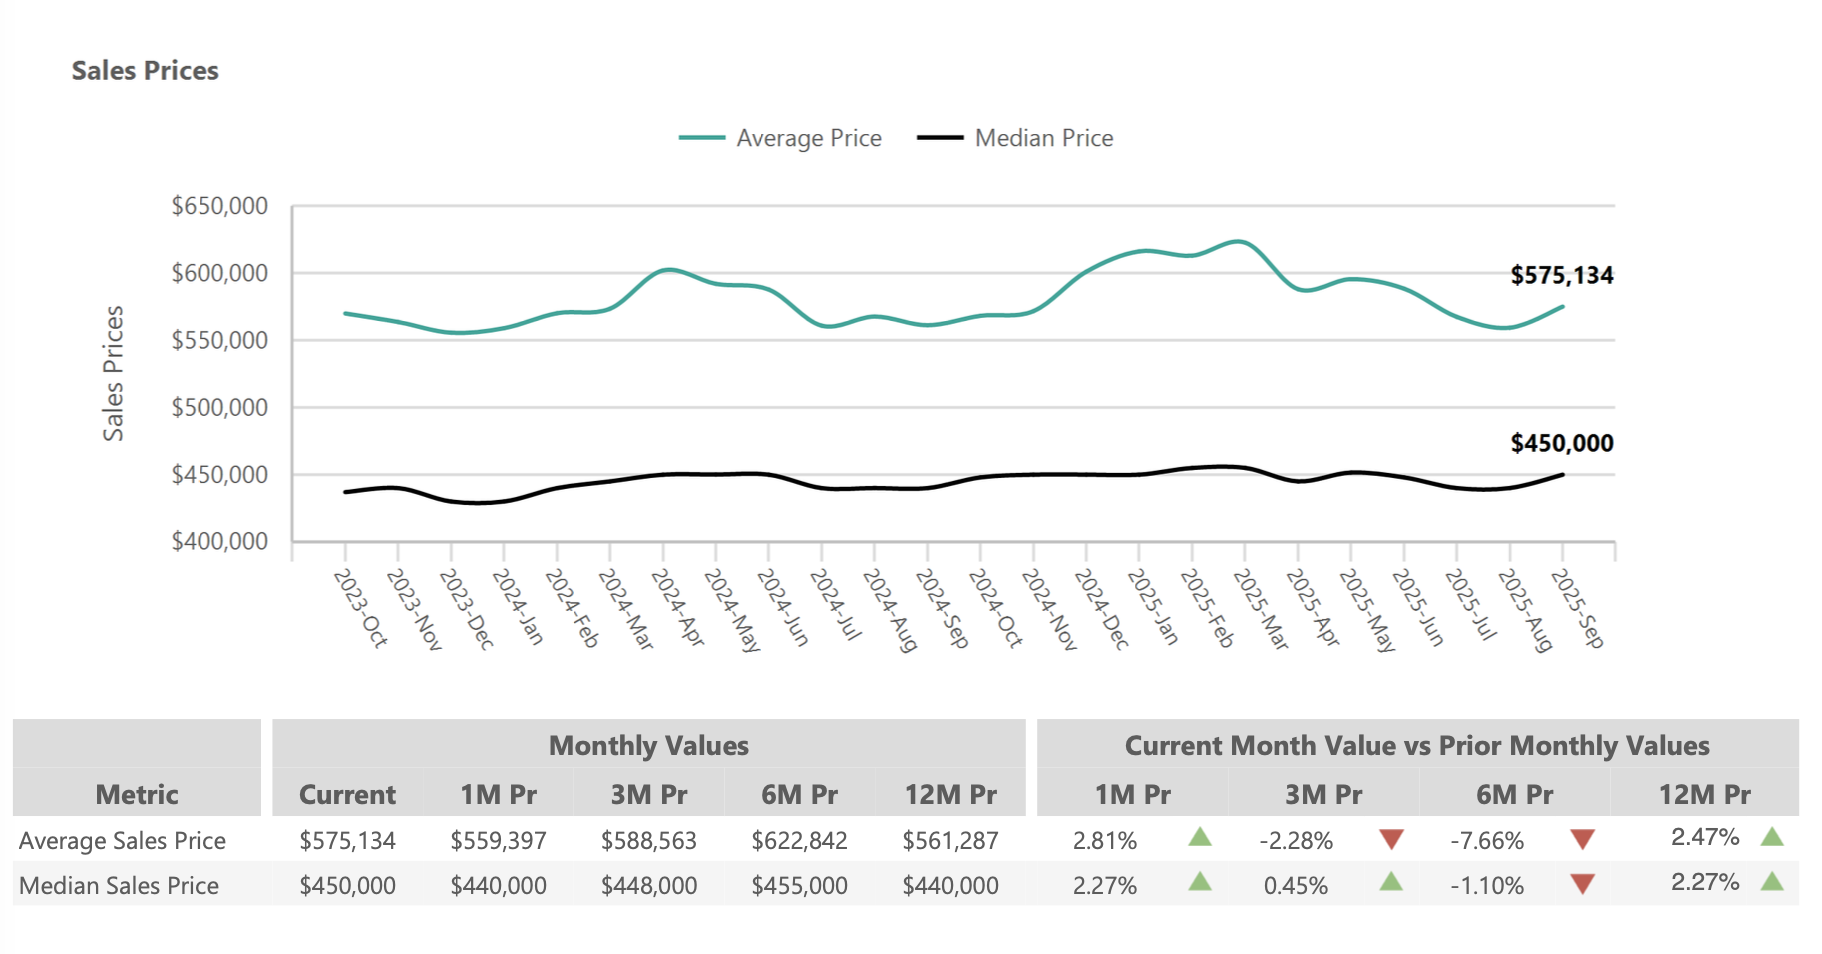
Average sale prices reached their recent peak in spring 2025 (around $620K in March) before easing back by roughly 7-8% to the current ~$575K level. This gentle downtrend followed by stabilization reflects how higher interest rates imposed a natural cap on prices, especially in the luxury segment. Notably, the median price declined much less from the peak than the average price did – an indication that affordable and mid-market homes held value better while the upper end saw more significant adjustments. The narrowing gap between the average and median price suggests the market has worked through the overpricing of high-end properties, and pricing is normalizing across the board. Instead of the sharp corrections of the past, Phoenix is experiencing a soft landing in values: a testament to the region’s strong buyer demand and lack of distress (few foreclosures or forced sales). Buyers no longer expect huge price drops, and sellers have accepted that the double-digit annual gains of the pandemic era are over. This mutual understanding has led to price agreements that are fair and sustainable, establishing a new equilibrium for Phoenix home values.
3- Neighborhood Price Variations
Phoenix’s headline price numbers mask significant variation by neighborhood. Local factors – school districts, commuting distance, community amenities, and housing stock – all influence pricing. For instance, South Phoenix maintains median prices around $470,000, benefiting from its proximity to downtown and ongoing revitalization efforts in the area (parks, light rail expansion, etc.). In the historic Encanto district, with its tree-lined streets and 1920s charm, median prices are closer to $535,000–$540,000, as buyers pay a premium for character and central location. In contrast, the North Mountain area of Phoenix offers more affordable options, with medians roughly $380,000, attracting first-time buyers and budget-conscious families. The Alhambra neighborhood presents some of the most accessible prices, around $350,000 median, reflecting smaller homes and older inventory but also providing opportunities for value-oriented buyers. These variations mean buyers have options across a wide range of price points. Notably, homes in top-rated school districts in suburbs like Chandler or Scottsdale often command a 10–20% premium over similar homes in areas with less celebrated schools.
Additionally, proximity to major employment hubs (Downtown Phoenix, the Price Road Corridor in Chandler, Scottsdale Airpark, Tempe tech hub, etc.) tends to boost home values in those areas. Phoenix’s diverse sub-markets allow buyers to find homes that balance location, amenities, and budget – whether it’s paying more to be near work and top schools, or choosing a more affordable area and commuting. For investors and move-up buyers alike, this patchwork of micro-markets underscores the importance of local market knowledge when assessing property values.
Phoenix Housing Inventory Surge: 23,352 Active Listings
1- Record Inventory Growth
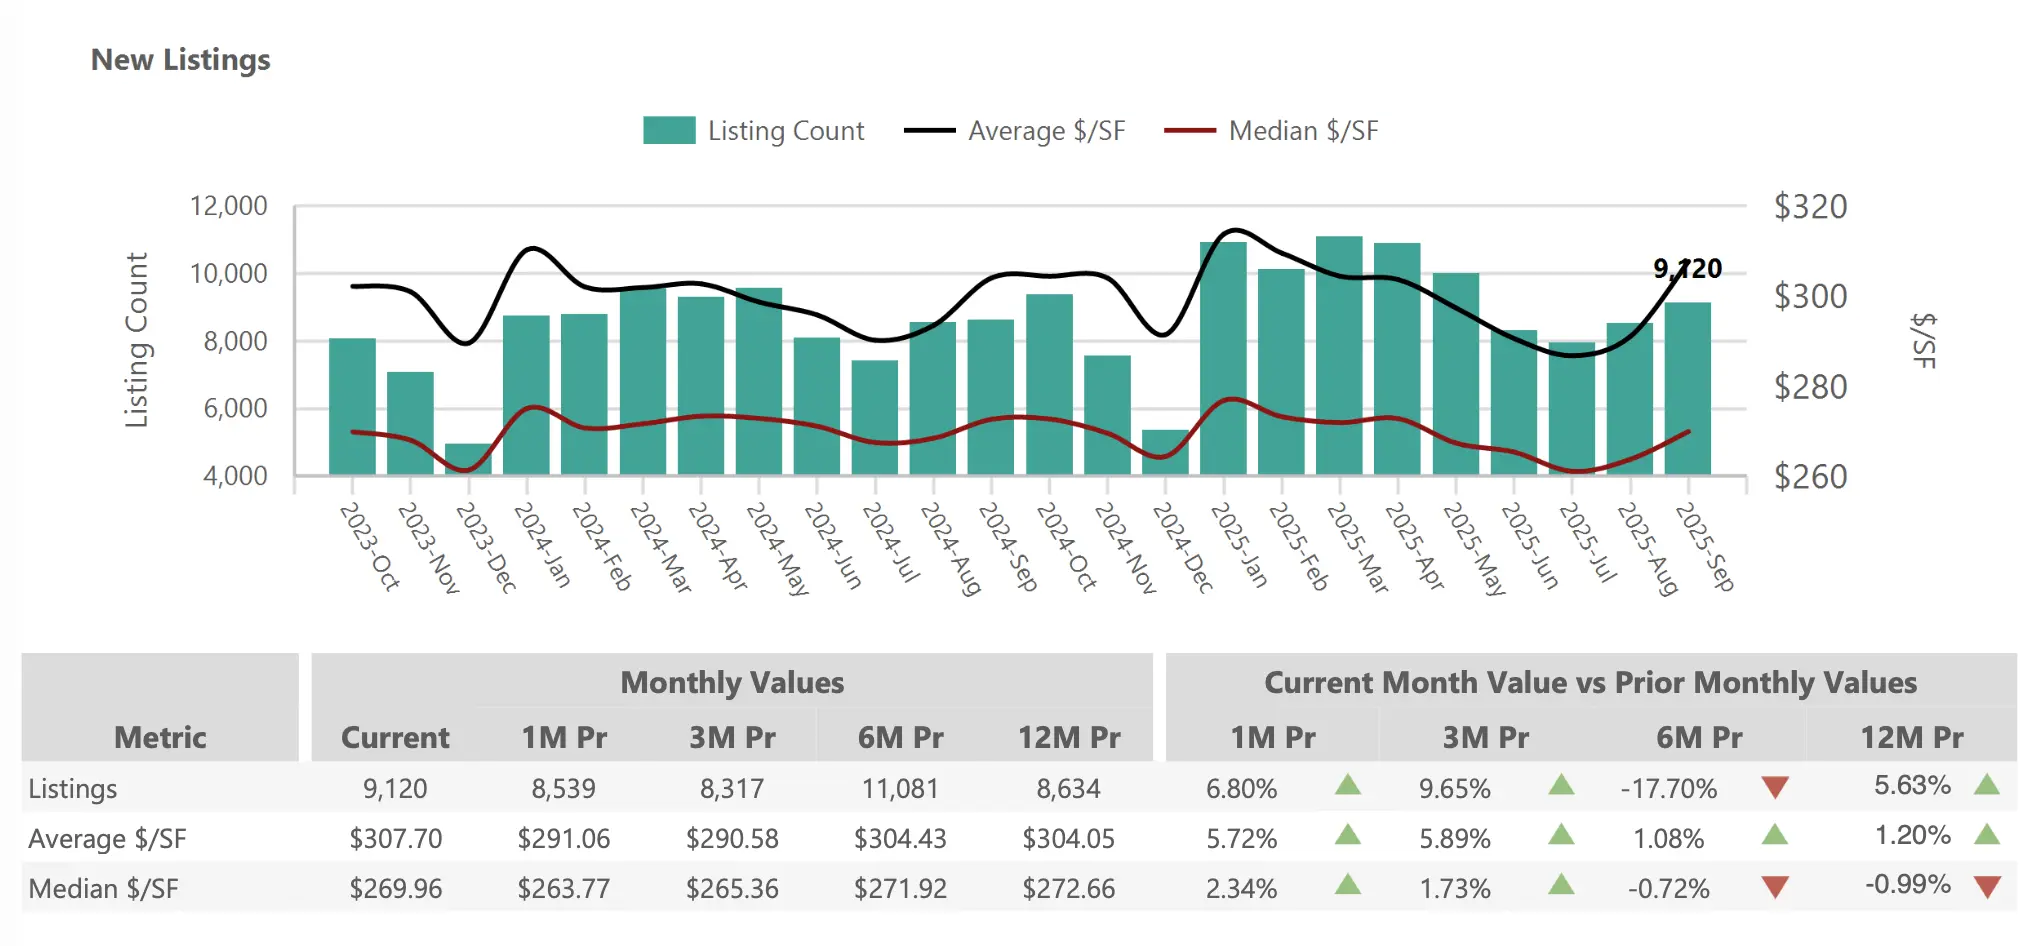
The most striking development in Phoenix’s September 2025 housing market is the sustained surge in active inventory. There are 24,154 homes for sale, a 24% increase compared to September 2024. Buyers now have more options than at any time in recent years, fundamentally altering the market dynamic from the ultra-competitive environment of the pandemic boom. This inventory expansion is the culmination of several trends: more sellers listing homes (new listings were up 12% year-over-year in September), homeowners who had postponed selling (due to uncertainty or low interest rate “lock-in”) finally entering the market, and a wave of new construction completions adding to supply. With over 24,000 homes on the market, Phoenix buyers can afford to be selective in a way that was impossible just two years ago. This dramatic increase in choices has psychological impacts as well – buyers report feeling less pressure to “grab whatever they can find”, and more ability to wait for the right home. Sellers, on the other hand, face the reality that competition is stiff; each home must stand out on price and condition to attract offers. Overall, the inventory surge represents a fundamental shift toward a more balanced market, ending the scarcity-driven bidding wars of the recent past.
Inventory Metrics:
Active Listings: 24,154 (+24.2% year-over-year)
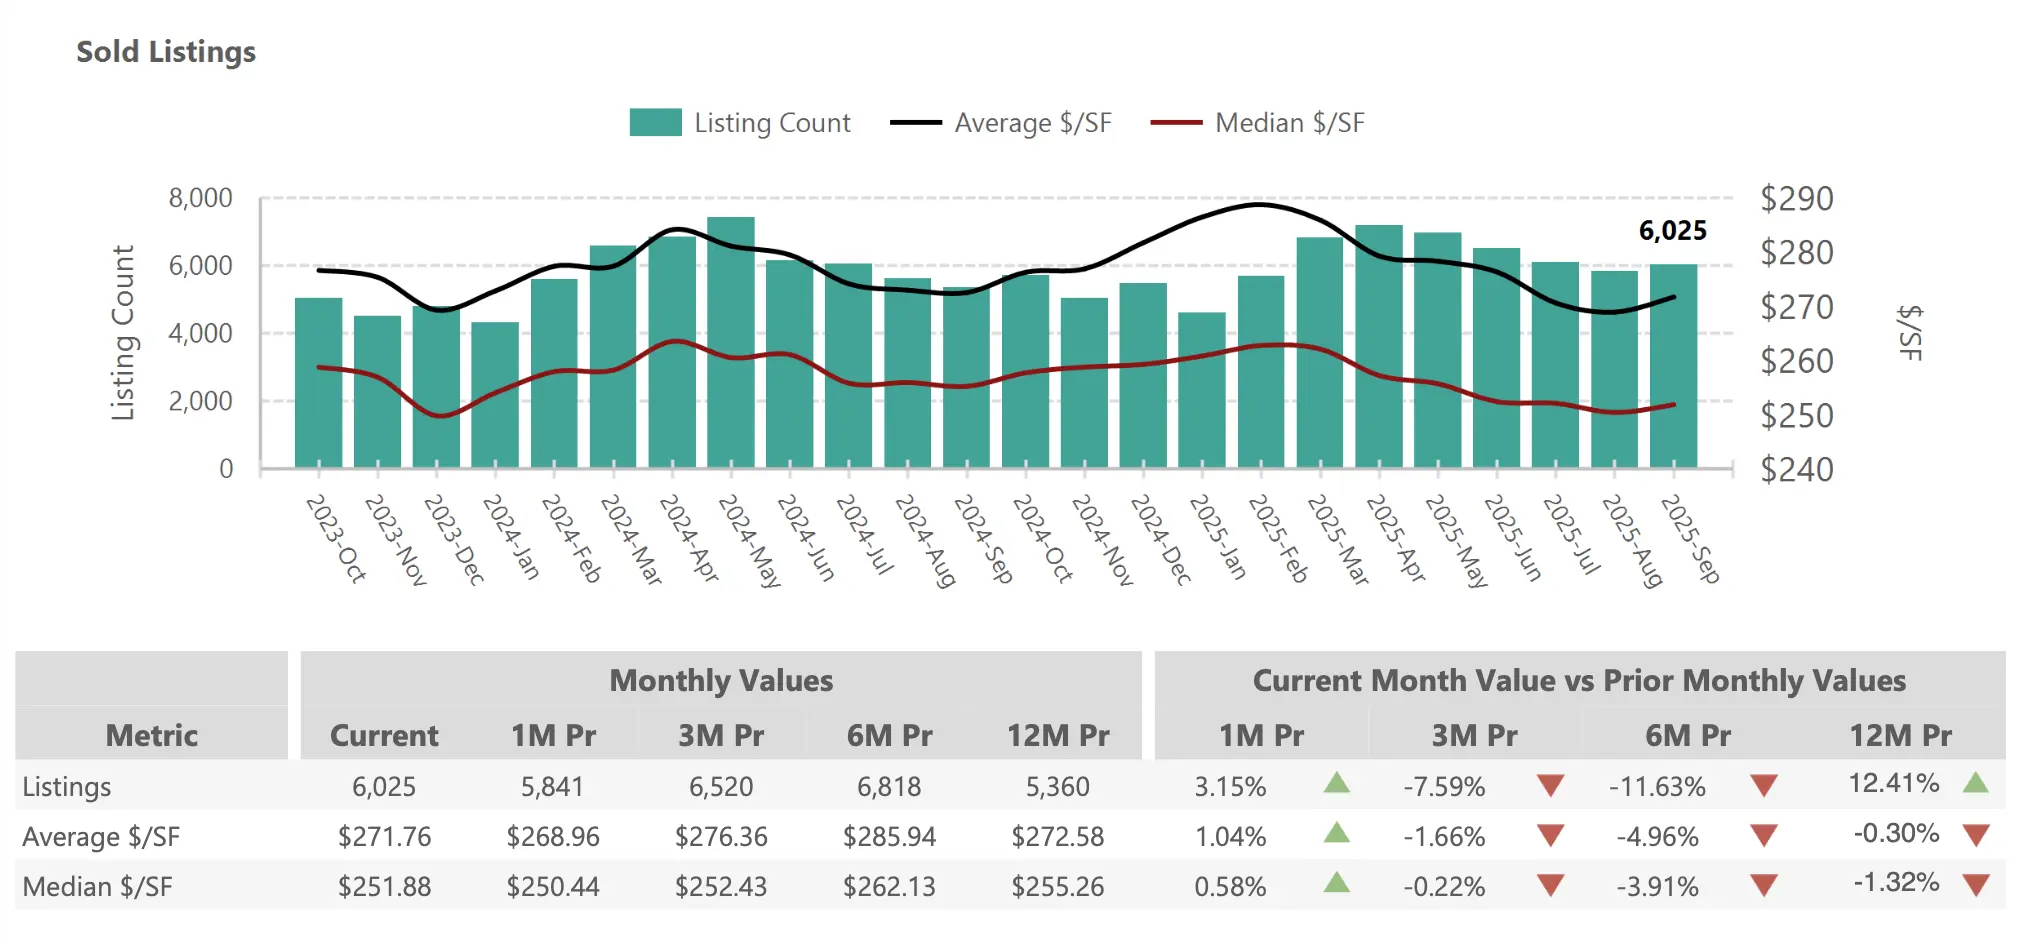
New Listings (Added in Sept): 6,025 (+12.4% year-over-year)
Months of Supply: 4.01 months (+10.5% year-over-year)
Absorption Rate: 24.94% (-9.5% year-over-year)
2- Seasonal Patterns and Trends
Phoenix inventory typically peaks in late spring each year, and 2025 followed this pattern. Active listings topped 26,000+ in May 2025 during the spring selling season. By September, listing counts have declined to 24,154 as some spring and summer listings either sold or were taken off the market. This seasonal dip is normal – the extreme heat of an Arizona summer often discourages both sellers and buyers, leading to fewer new listings and sales in July/August. However, even with the usual late-summer slowdown, inventory remains far above where it stood in recent years at this time. In September 2024, active listings were only around 19,450; in September 2023, they were even lower. The fact that 2025’s inventory stayed high through the summer (despite fewer new listings month-to-month) points to some structural changes in the market. Sellers are keeping their homes on the market longer instead of pulling them off, showing confidence that the right buyer will come along even if it takes extra weeks or months. Builders have also contributed by continuing to finish projects and list new homes, adding supply even in the slower season.
Additionally, new listings in September 2025 outpaced last year (6,025 vs ~5,360 in Sept 2024) – an indicator that more homeowners are willing to sell now than a year ago, possibly because home values have stabilized and they feel they can get a fair price. The overall result is that inventory in late 2025 is elevated even as seasonal factors normally would contract supply. This resilience of listing availability suggests Phoenix’s market is undergoing a permanent shift out of the ultra-tight supply conditions, driven by factors like rising construction and waning buyer frenzy.
The absorption rate – the share of the inventory that sells each month – stands at 24.94% for September, meaning roughly one-quarter of active listings sold within the month. A year ago, the absorption rate was about 27.5%, so the pace of sales relative to inventory has slowed. During the red-hot market of 2021-2022, absorption rates regularly exceeded 50%, and even in late 2022 were around one-third. The current slower absorption reflects the shift toward a buyer-friendly market: homes are no longer flying off the shelves, and some listings will take multiple months to find a buyer. This correlates with the extended days on market and increased negotiations we’re seeing. Buyers now have the luxury of time – they can view several properties, deliberate, and perhaps see a home multiple times before making an offer, a stark contrast to the one-day-on-market, “better bid now” frenzy of two years ago. Market professionals report that this calmer pace allows for more thorough inspections and appraisals, and financing is proceeding at a more measured, orderly speed, reducing the stress on all parties. While a slower absorption rate might seem like a negative for sellers, it contributes to more solid transactions – buyers are less likely to walk away due to rash decisions or buyer’s remorse, and sellers who price and present their homes well will sell, just not overnight. All of this points to a market that’s healthier and more sustainable in the long run.
3- Supply and Demand Balance
With 4.01 months of supply in September, Phoenix is hovering just below the classic 5–6 month inventory level considered a “balanced” market. This is a dramatic change from the sub-2 months of supply during the peak seller’s market of 2021, when inventory was so low that homes would get multiple offers within days. At 4 months of supply, Phoenix is now much closer to equilibrium – buyers have enough choices that they aren’t pressured to snap up the first house they see, yet inventory isn’t so high as to overwhelmingly favor buyers (which would be 7+ months of supply). Many real estate economists consider a range of about 4–6 months ideal for healthy market function: it gives buyers time for due diligence and comparison shopping, while still ensuring that most reasonably priced homes will sell in a few months. Phoenix’s trend toward this balanced range suggests the market is achieving a sustainable footing. Minor economic fluctuations (like small interest rate changes or seasonal lulls) are less likely to cause wild swings in price or sales volume when supply and demand are in better alignment. In short, the frantic extremes have eased, and a more normal market cycle is emerging.
The increased supply and tempered demand create advantages for buyers that haven’t been seen in some time. With more inventory, buyers can compare multiple similar properties without feeling rushed. It’s now feasible to visit a dozen homes over a few weeks and then decide, whereas two years ago a buyer might have been lucky to get a showing at a couple of homes before they went under contract. This breathing room means buyers can insist on inspections, negotiate repairs, and include normal contingencies – practices that many waived during the frenzy. We’re seeing more offers with seller concessions (such as closing cost assistance or mortgage rate buydowns), which help buyers manage affordability in a higher-rate environment. From the seller’s perspective, reaching a deal might take longer, but the deals that do happen are more likely to stick (fewer fall-throughs) because buyers have fully vetted their choice. Most well-priced, well-presented homes still sell in this market, though not always with multiple offers or above asking. In fact, it’s often the best-prepared listings in desirable locations that can still attract quick interest – those priced competitively and move-in ready can even see multiple offers, as savvy buyers recognize their value. However, the days of across-the-board bidding wars are essentially over. Instead, Phoenix’s housing market is now characterized by orderly negotiations and more balanced terms, which ultimately benefit both sides by reducing post-contract surprises and fostering transactions where everyone feels they’ve achieved a fair outcome.
Days on Market: Homes Taking Longer to Sell
1- Extended Selling Times
Phoenix homes are taking significantly longer to sell in September 2025. The median days on market (DOM) reached 65 days, up from 51 days in September 2024 – a 27% increase in marketing time. Similarly, the average DOM is now 86 days (nearly three months), about 15 days longer than a year ago on average. This extended timeline marks a fundamental shift in market psychology: buyers no longer feel the need to rush to make an offer within 24–48 hours. Instead, they can take a week or two to consider a home before deciding to bid, and many sellers are having to wait several weeks to find a buyer. It’s important to note that properly priced homes – those listed at a fair market value for their condition and location – still tend to receive offers within 2–4 weeks. However, overpriced listings can languish for 60 days or more with little buyer interest, often necessitating price reductions to attract offers. The increase in DOM is most pronounced for higher-priced and less-updated properties, where buyers are being especially choosy. Entry-level homes, in contrast, might still sell relatively quicker (since demand is strong in that segment), though even those aren’t immune to the broader slowdown. Overall, the longer selling times underscore the shift to a buyer’s market mentality – patience is now a virtue for buyers, and urgency has left the marketplace compared to the frenzy of two years ago.
Days on Market Data:
Median DOM: 65 days (+27% year-over-year)
Average DOM: 86 days (+21% year-over-year)
Month-over-month: Essentially unchanged from August (median DOM down 1 day from 66 in August, average DOM flat)
2- Market Psychology Shift
The lengthening of DOM reflects a major shift in market psychology for both buyers and sellers. Buyers are no longer fearing that if they “hesitate today, the house will be gone tomorrow.” In 2021–2022, many buyers felt compelled to make an offer within hours of a listing hitting the market. Now, with abundant inventory, buyers can take their time to view a property multiple times, compare it with others, and even wait to see if the seller drops the price. This has eased a lot of the anxiety and stress on the buy side. Sellers, on the other hand, must adjust their expectations. Instead of assuming a weekend open house will yield multiple offers, sellers now need to prepare for a potential 2-3 month sale timeline.
This means budgeting for extra mortgage payments and maintaining the home in show-ready condition for longer. Pricing strategy is crucial – homes priced right (in line with recent comparable sales) are the ones still getting quick interest. If a home is overpriced for its condition or location, today’s buyers will simply pass it by, leading to extended DOM and likely a price reduction down the line. The slower pace of sales is actually leading to better outcomes in many cases: buyers are making offers on homes they’ve thoughtfully vetted, and sellers are dealing with buyers who are more committed (since those buyers had time to be sure of their decision). The negotiation dynamic has also changed – with more time on market, buyers feel emboldened to ask for repairs or credits, and sellers are more willing to concede, whereas in a frenzy market buyers would often waive contingencies and take homes “as-is.” All these changes point to a market driven less by emotion and FOMO (fear of missing out) and more by rational decision-making.
Properties that are priced correctly for current market conditions typically still receive offers within a few weeks. Well-presented homes (professionally staged, photographed, and marketed) might stand out and sell faster than the average. However, overpriced listings can sit for 2+ months with little activity. We’re seeing many such listings require a mid-course price correction – after 30-60 days on market with no sale, sellers are cutting the price by 3-5% or offering incentives like paying for the buyer’s closing costs to secure a deal. In short, sellers can no longer bank on rapid appreciation or buyer desperation; they must meet the market where it is today. The upside is that once a price is adjusted appropriately, buyers are out there and ready to make fair offers.
3- Strategic Implications
For sellers, the longer DOM environment emphasizes the importance of:
Accurate initial pricing: Study recent comparable sales and price your home realistically from the start. The first 2–3 weeks of listing are critical – you don’t want to squander that window with an inflated price that scares off buyers.
Quality presentation: Invest in professional staging and high-quality photos. With more homes on the market, presentation is key to attract buyer interest. Curb appeal, minor repairs, and decluttering can make your home stand out.
Strategic marketing: Be prepared for a 60–90 day marketing timeline. This means keeping your home in show-ready condition for longer and perhaps doing multiple open houses. Consider refreshed marketing (new photos, updated listing description) if interest is low after the first month.
Flexibility in negotiations: In a cooler market, sellers should be prepared to offer concessions. This could include paying for a home warranty, agreeing to reasonable repair requests, or contributing to the buyer’s closing costs or an interest rate buydown. A bit of flexibility can go a long way in getting a deal to the finish line.
For buyers, the extended DOM is full of opportunity:
Negotiating leverage: Homes sitting on the market 30+ days often have more motivated sellers. Buyers can sometimes negotiate below asking price on such listings, especially if there have been price reductions or if the home is vacant.
Due diligence freedom: With less competition, buyers can take the time for thorough inspections and even a second showing or neighborhood walk-through. There’s less pressure to waive appraisal or inspection contingencies – you can ensure the home truly meets your needs and is in good condition before committing.
Seller concessions: Don’t hesitate to ask for seller-paid closing costs, repairs, or even a rate buydown. Many sellers are willing to accommodate reasonable requests, as they’re happy to have a serious buyer after weeks on market.
Patience pays off: You have the luxury to wait for the right house. Use this time to monitor listings; a home that didn’t fit your budget at first might undergo a price cut. Stay in close contact with your agent about any status changes (like price reductions or back-on-market homes) to capitalize on opportunities.
Actionable Advice for Market Participants
For Buyers
Opportunities in Current Market:
More inventory = better selection: With listing counts up over 20% year-on-year, buyers can explore a wider range of homes and find one that truly fits their needs – whether that’s a specific school district, a large backyard, or a home office setup. You’re far less likely to have to “settle” for whatever is available.
Negotiation leverage: Homes sitting on the market longer (median 65 days now) give buyers leverage to negotiate on price and contingencies. You can take the time to include inspection, appraisal, and financing clauses and request repairs or credits without worrying that the seller has ten other offers.
Thorough due diligence: The reduced pace means you can and should fully vet a property – get a detailed inspection, review HOA rules, check out the neighborhood at different times of day – all without the fear of losing the home to a faster bidder. Fewer bidding wars mean you can make decisions with your head, not just your heart.
Strategic Recommendations:
Get pre-approved early: Even though urgency has eased, desirable homes can still sell fast. Be ready to act by obtaining a mortgage pre-approval before you shop. When you do find “the one,” you’ll be able to submit an offer quickly with financing in place – a key way to stand out to sellers.
Focus on value: With more choices on the market, hone in on well-priced homes in good condition. These properties tend to sell the fastest in a cooler market. Work with your agent to recognize when a home is a great value – you’ll want to move decisively on those to avoid missing out.
Watch new listings & old listings: Keep an eye on new listings – they often garner the most attention and if priced right can go under contract relatively quickly even in this market. At the same time, monitor stale listings (60+ days) – these could be ripe for a bargain. Your agent can help identify sellers who might be open to a below-list offer due to long DOM.
Negotiate creatively: Don’t just think in terms of price. Perhaps ask the seller to buy down your mortgage rate, or include appliances/furniture in the sale, or pay for some closing costs. In a balanced market, creative win-win negotiations are back on the table. Aim to craft offers that address both your needs and the seller’s – e.g., a flexible closing date in exchange for a lower price.
For Sellers
Current Market Realities:
Heightened competition: With active listings up over 24% from last year, buyers have many more choices. Your home is competing for attention, so you must approach the market strategically – gone are the days of listing any property and expecting a bidding war.
Longer timelines: Be mentally and financially prepared for an extended selling process. The median home is now on market over two months. It may take 8, 10, or even 12+ weeks to find the right buyer. Patience is key; panic price drops in the first two weeks are usually not necessary.
Necessary concessions: In today’s market, it’s common for buyers to ask for repairs or closing cost assistance. Roughly 42% of September sales involved some form of seller concession (per ARMLS data). Expect that you might need to give a little to get the deal done – whether it’s fixing an item from the inspection or helping with closing fees. This is normal in a balanced market and not a sign your home isn’t desirable – it’s just part of negotiations now.
Success Strategies:
Price competitively from the start: Work with a knowledgeable agent to analyze the most recent comparable sales. In a shifting market, even sales from 3–4 months ago might be outdated. Aim to be the best-priced option in your segment (for example, among 4-bed/3-bath homes in your area) when you hit the market. A well-priced home will attract buyer interest even with more competition.
Maximize presentation: Invest time and money in making your home shine. Professional staging, cleaning, and high-quality photos are no longer optional if you want top dollar. Online appeal is crucial – most buyers will see your home first on a website. Also, address minor repairs or updates (fresh paint, landscaping) before listing; a move-in-ready home can motivate buyers to choose yours over others.
Plan for 60-90 days on market: Align your expectations with the new reality. It may take a few months to sell; plan your next steps accordingly (whether it’s carrying two mortgages for a bit, or arranging a short-term rental if you sell faster than expected). Discuss with your agent what the marketing game plan is if you haven’t received serious offers after the first 30 days – sometimes a pricing adjustment or new marketing push can reinvigorate interest.
Stay flexible and responsive: When an offer does come in, take it seriously. Even if it’s not exactly what you hoped for, engage with the buyer and negotiate. Perhaps you wanted a 30-day close but the buyer needs 45 days – accommodating that could make the deal work. Or maybe the offer is slightly below list – consider the carrying costs if you wait for a higher offer. In this market, a bird in hand is often worth two in the bush. Remain open to fair repairs or credits; showing goodwill in negotiations can keep the buyer committed and the deal moving forward.
For Investors
Market Opportunities:
Discounts on aged listings: Higher DOM isn’t just an opportunity for homebuyers – investors can also capitalize. Properties that have sat unsold for months may be acquired below market value, especially if the seller is carrying costs they’re eager to offload. Keep an eye on listings with multiple price cuts or those vacant for a while; these could be prime for a bargain buy, renovation, and flip.
Robust rental demand: Phoenix’s population and job growth haven’t stalled, even if purchase demand has moderated. Rental demand remains strong, bolstered by would-be buyers who are sitting out temporarily due to interest rates. This supports buy-and-hold strategies – purchasing homes now (potentially at a slight discount) and renting them out can yield solid cash flow, with the expectation of future appreciation. Ensure you run the numbers: many investors target areas with high rent-to-price ratios (e.g., suburbs with good schools or multi-family properties in central locations).
Flip cautiously – focus on entry-level: If you’re in the fix-and-flip game, note that the luxury flip market has softened more than the entry-level. Aim for projects in the median price range or lower, where buyer demand is still healthy. Homes under the FHA loan limit, for example, have a larger buyer pool. Also, build in extra time and cost buffer for flips – buyers are picky, so quality work is essential to get your rehabbed property sold in a reasonable time. Conservative ARV (after-repair value) assumptions are a must; price gains are not a given in the short term, so the deal has to make sense with flat prices.
Risk Management:
Maintain a solid equity cushion: With more market uncertainty, flip investors should budget for lower resale prices than the peak comps and make sure there’s a 10-15% profit margin as a cushion. If unexpected costs or a small market dip occurs, this equity buffer will protect you from losses. Don’t over-leverage or assume double-digit appreciation – those days are over (for now).
Prioritize cash flow for rentals: For buy-and-hold investors, focus on properties that can be cash-flow positive from day one at today’s rents and interest rates. Don’t count on refinancing to a lower rate soon; make sure the property works at current rates. If you can put down a larger down payment to reduce your loan, it might be worth it for better cash flow. Phoenix’s rents are strong, but also consider future rent growth conservatively. Areas with stable or growing employment nearby are your best bet for reliable tenants.
Consider build-to-rent and new builds: The Phoenix area has several new build-to-rent communities and new construction homes available. Builders facing slower sales might offer discounts or bulk deals to investors. If you have capital, purchasing brand-new homes or townhomes to rent out can reduce immediate maintenance costs and attract tenants looking for modern amenities. Just be cautious of HOA rules and make sure leasing is permitted if it’s in a subdivision. Diversifying into new builds could be a smart play as part of your portfolio, alongside traditional resale homes.
Phoenix Housing Market Video Update
Watch our September 2025 Phoenix Housing Market Update for a quick, visual breakdown of the numbers behind this month’s report. In just a few minutes, you’ll see charts and explanations of price trends, inventory changes, and what they mean for you as a buyer or seller. Our video highlights the key stats and provides additional context on interest rates and economic factors influencing Phoenix real estate today. Don’t miss this overview – sometimes a visual snapshot makes the market’s status crystal clear.
Conclusion: A Balanced Market Emerges
The Phoenix housing market in September 2025 represents a healthy recalibration from the extreme conditions of recent years. We now see balance emerging where once there was frenzy. Price stability (even modest gains) combined with greatly expanded inventory has created opportunities for both buyers and sellers – but succeeding in this market requires adapting to the new dynamics.
Key market themes include:
Stabilization over volatility: The era of whiplash-inducing price jumps is behind us. Moderate, steady trends are now the norm, which is positive for market health and planning purposes.
Choice over scarcity: Buyers can finally choose from a range of options instead of fighting over one listing. This choice leads to more satisfactory outcomes – people buying homes that truly fit their needs.
Strategy over speed: In 2021, speed was everything. Now, strategy wins the day. Thoughtful pricing, savvy negotiations, and proper preparation have taken the place of frantic bidding wars.
Balance over extremes: Neither buyers nor sellers have an overwhelming upper hand. Each side must come to the table and find a middle ground. This balance fosters more equitable transactions and a more resilient market.
Phoenix’s housing sector appears well-poised as we head into the end of 2025. While we don’t expect a return to the runaway seller’s market of the pandemic, the city’s strong job growth, attractive lifestyle, and ongoing in-migration should provide a solid foundation for housing demand. For buyers, this means you can proceed with confidence that you won’t be overpaying at an unsustainable peak. For sellers, it means that if you price and present your home well, it will sell – maybe not overnight, but to a motivated buyer who appreciates it. The current environment rewards those who stay informed and work with seasoned real estate professionals. Whether you’re a first-time homebuyer, a move-up seller, or an investor, understanding the trends and stats (like those in this report) will help you make the best decisions.
For more personalized insights or guidance on navigating this evolving market, reach out to the Phoenix real estate experts at PhoenixHomes.com. Our team is on top of the latest data and is ready to help you craft the right strategy – whether that’s timing your sale for maximum return or negotiating a great deal on your next home. The Phoenix housing market may have changed, but with the right knowledge and partner by your side, your real estate goals in 2025 are well within reach.